


Talking Points:
- The ISM non-manufacturing figure was 55.7 versus an expected 58.6
- Last month’s figure was 59.1, July’s drop is the largest since August 2016
- The dollar fell lower as markets reach the end of a busy week for economic data
Third Quarter Forecasts for Currencies, Commodities and Equities are out! They can provide useful insight to enhance your trading opportunities.
US ISM Non-Manufacturing Falls Most in Eleven Months
The ISM non-manufacturing survey fell to an eleven-month low in July, bogged down by pullbacks in orders and business activity. The report revealed similar findings to data released earlier this week in Tuesday’s consumer confidence report and Wednesday’s ISM manufacturing survey. The information provided shows early signs of a cooling economy, even as unemployment reached 3.9%.
July’s service numbers suffered the largest drop since August 2016 but remain in expansionary territory. The non-manufacturing index slumped to 55.7 versus the expected 58.6 and 59.1 from June. Measure of business activity declined to 56.5 from 63.9. The decline was the largest the particular reading felt since 2008. Gauge of new orders also slumped significantly, forfeiting 6.2 points to 57.
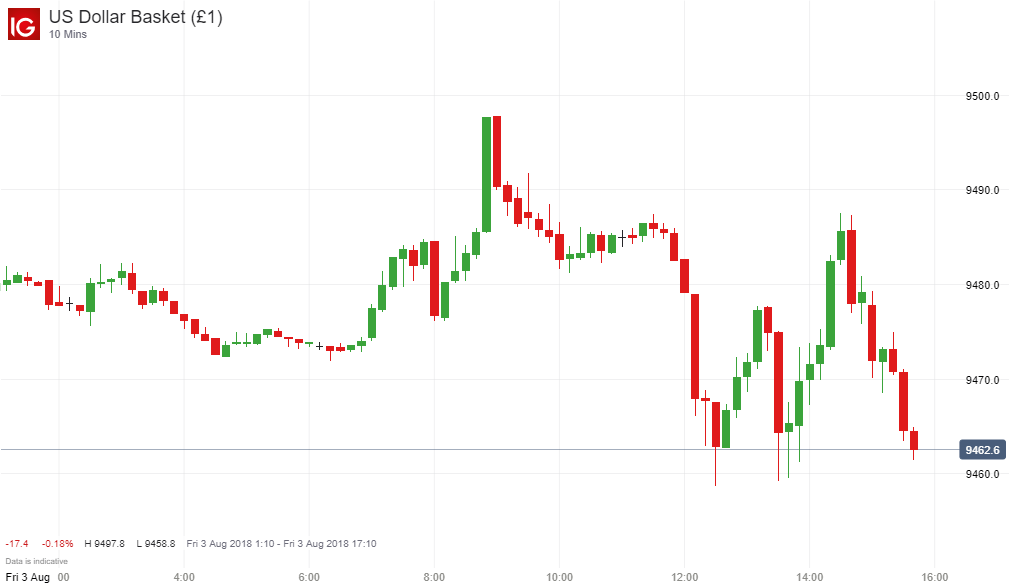
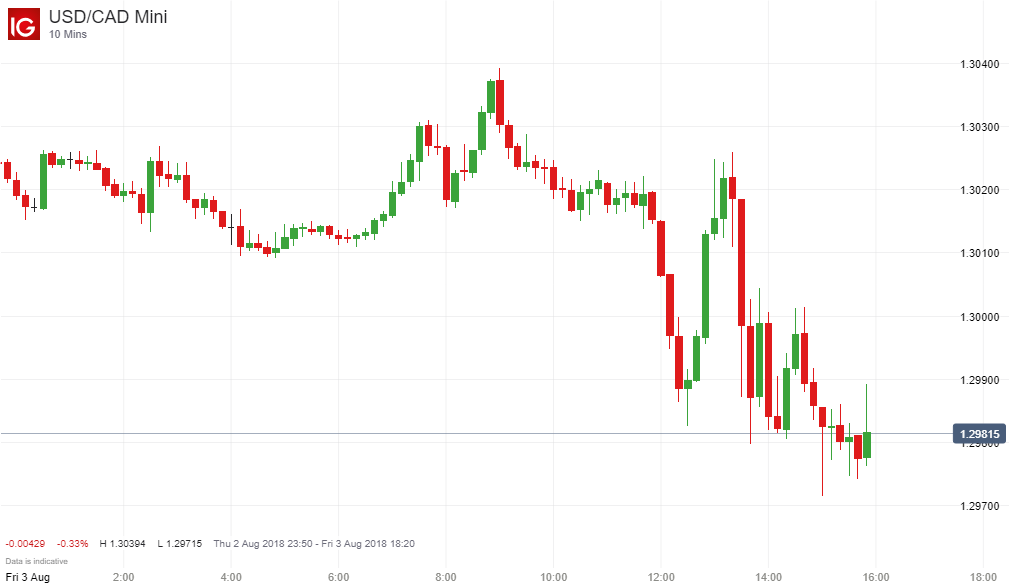
The disappointing figures dealt a blow to the US dollar, already hampered after a miss on non-farm payrolls earlier Friday. USD/CAD fell from intraday heights near 1.3040 to the 1.2980 range. Despite the dollar’s decline, the dollar basket remains near highs since late May. Current levels weigh in around 94.65 and could see significant alteration following the release of US inflation data next Friday.
US Dollar Basket Price Chart (DXY): 10-Minute Time Frame, August 3 (Chart 1)
USD/CAD Price Chart: 10-Minute Time Frame August 3 (Chart 2)
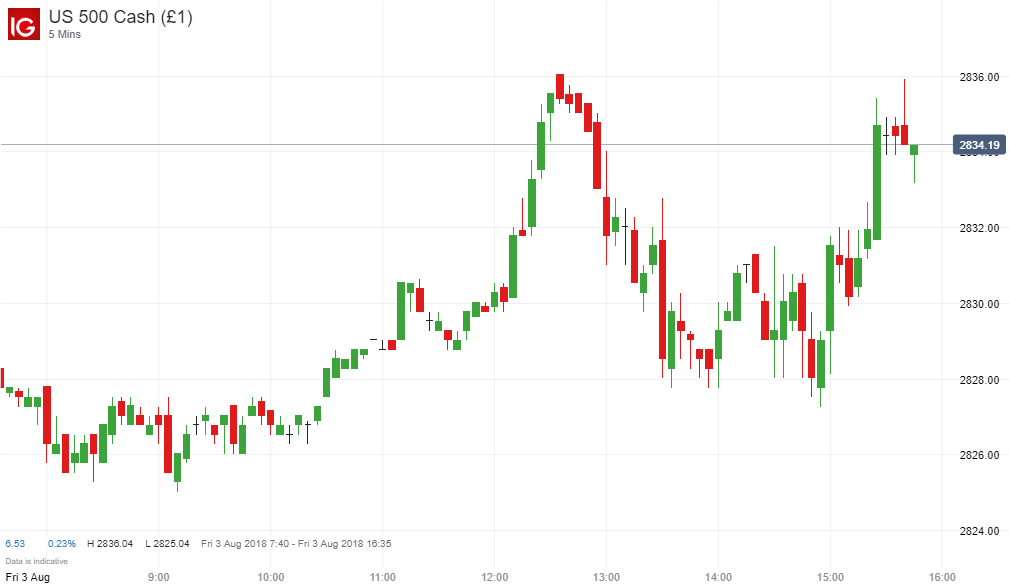
S&P 500 Presses Forward
US equities shrugged off the worrisome news, with the S&P 500 climbing slightly into the green. Despite the signs of economic slowdown and renewed trade war threats from China, Apple’s strong performance and trillion-dollar valuation seem to offer continual support for indices.
S&P 500 Price Chart: 10-Minute Time Frame August 1 (Chart 3)
Written by Peter Hanks, Junior Analyst for DailyFX


