


Ethereum (ETH): Price, Chart and Analysis
- Ethereum technical set-up looks weak with lower highs and lower lows dominating.
- Cryptocurrency space remains weak.
IG Client Sentiment Report shows that retail inestors are still heavily long Ethereum.
Ethereum (ETH) Bounces off Noted Support – Will it Hold Another Attempt?
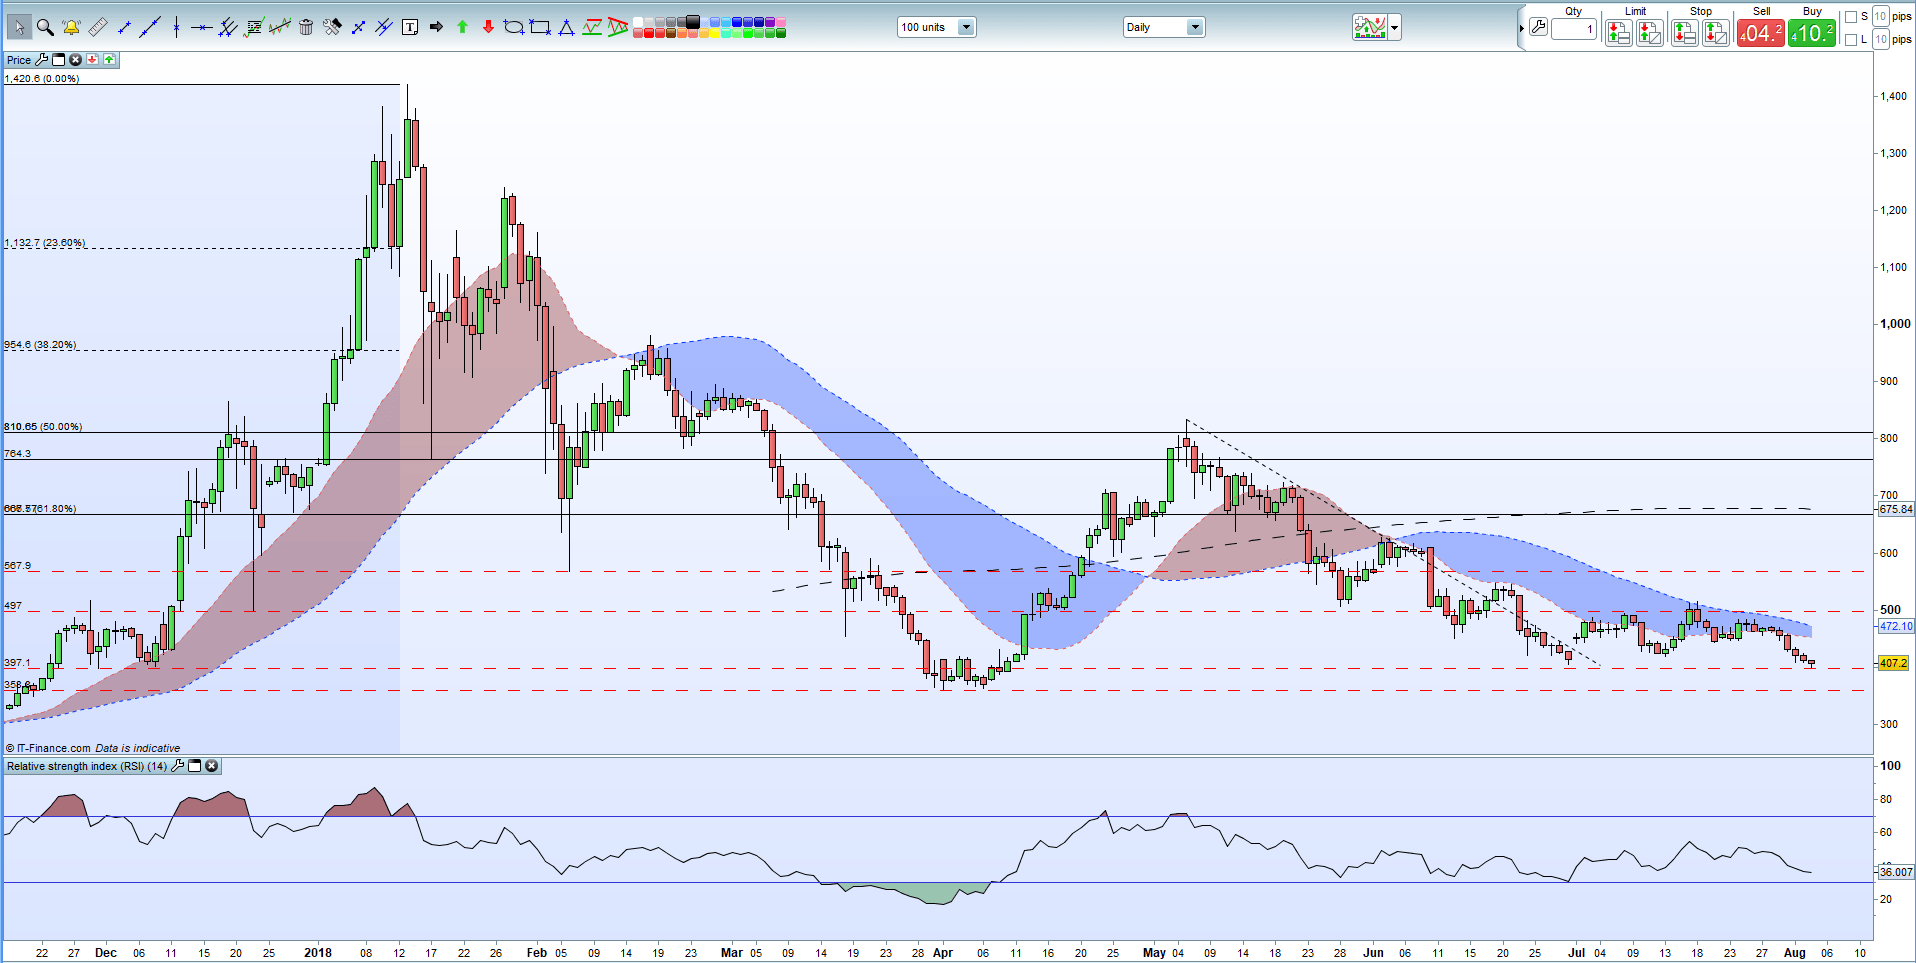
The second largest cryptocurrency by market cap continues to buckle under selling pressure and today touched an important support level at $397, the December 2017 swing low and precursor to the sharp rally up to $1,420. The level became active again in late March/early April and again acted a springboard to a rally back to $834. Since then the market has fallen steadily and a further break just below $400 would open $359 as the next level of support. Below here, support is at $275, a level last seen in October-November 2017.
Ethereum continues to trade below all three moving averages on the daily chart, a negative set-up, while the RSI indicator is pointing lower but nearing oversold territory. The last six daily candles all show lower highs and lower lows highlighting the current negative sentiment surrounding Ethereum.
The cryptocurrency market as a whole remains weak with the market capitalization dipping back down to $261 billion, the lowest level in over two weeks and around $40 billion off the market’s recent high. The latest turndown was given a push when the Winklevoss brothers latest ETF application was turned down with other applications still waiting in the wings with the SEC.
We covered Bitcoin, Ethereum, Bitcoin Cash, Ripple and Litecoin at this week’s Weekly Cryptocurrency Webinar on Wednesday and highlighted support and resistance levels for the five cryptocurrencies.
Ethereum (ETH) Daily Price Chart (December 2017 – August 3, 2018)
You can contact me on Twitter @nickcawley1 or via email at nicholas.cawley@ig.com.
--- Written by Nick Cawley, Analyst.


