


US - China Trade Wars
- Trump mulling tariff hike on $200 billion of Chinese goods.
- Gold unmoved – Chinese Yuan remains weak.
The DailyFX Q3 US Dollar Forecast is available to download.
US Eyeing Increased Tariffs on Chinese Goods
The US is considering increasing tariffs on $200 billion of Chinese goods – from 10% to 25% - as Washington turn up the dial in the increasingly acrimonious US-China trade war. In response to these ‘rumors’ China said that they would respond with their own countermeasures, adding that any talks between the two sides to ease trade tensions must be based on mutual respect and trust.
The financial markets however have seemingly ignored the noise from Washington and Beijing with risk-off assets little changed. The effect of any hike by the US in tariffs on Chinese goods can normally be seen quite clearly in a depreciation of the Chinese Yuan against the US dollar – the devaluation helps cover the tariff bill – but the pair remain stable around 6.83.
DailyFX senior currency strategist @CVecchioFX’s latest analysis – US-China Trade War Enters New Phase amid Yuan Depreciation outlines the effect of a weaker CNH in the current trade spat.
Gold Remains Strictly Correlated to the Chinese Yuan
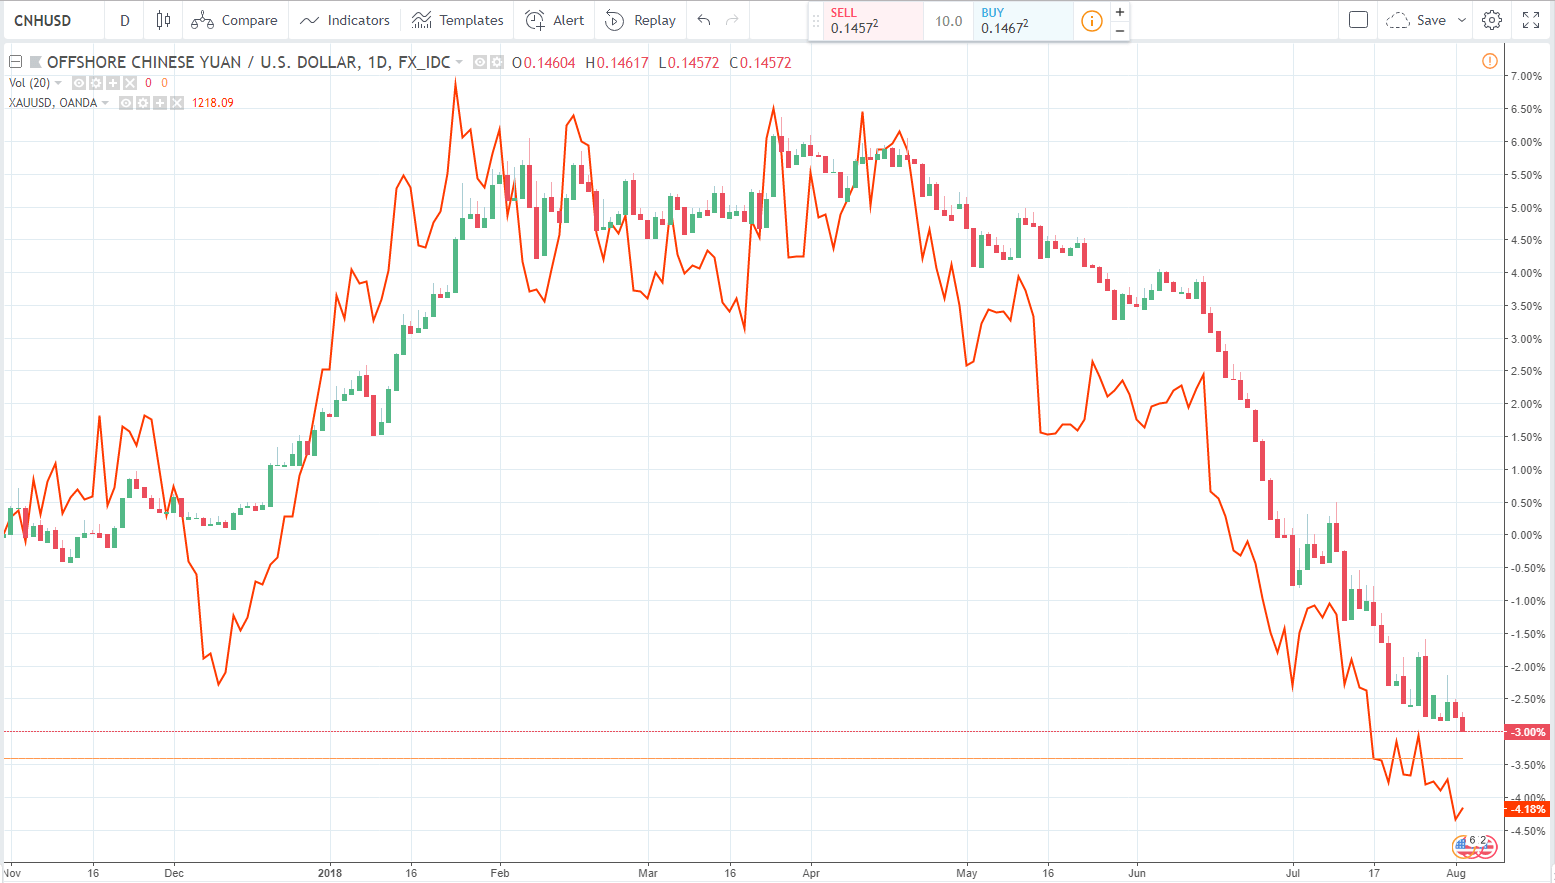
In times of heightened market risk, investors seek the safe-haven of gold, the Swiss Franc and the Japanese Yen, with the former the most favored. Gold remains weak however, with a weak Chinese Yuan and a strong US dollar weighing on the precious metal. The direct correlation between USDCNH and gold remains intact with the Yuan the driver of any move. Expectations of higher US interest rates continue with a third 0.25% hike this year priced in for September along with a fourth hike in December. The current price of gold may also be indicating that markets believe that the latest Washington talk of higher tariffs is more likely a negotiating tactic to bring China to the table, which could leave to a cooling of trade tensions.
Gold Price – Chinese Yuan Correlation Daily Chart (November 2017 – August 2, 2018)
Gold Downtrend in Control
The price of gold continues to be capped by a downtrend started from the recent high at the start of April. Fibonacci support at $1,215/oz. is currently holding but a break below would leave the July 10, 2017 low at $1,204.9/oz. firmly in play.
Gold Price Daily Chart (May 2017 – August 2, 2018)

Additional Trade War Primers and Walk Throughs – Recommended Reading:
The Impact of Tariffs and Trade Wars on the US Economy and the Dollar
A War to Trade More, Not Less - What’s Behind US-China Tariffs
Traders may also be interested in two of our trading guides – Traits of Successful Traders and Top Trading Lessons – while technical analysts are likely to be interested in our latest Elliott Wave Guide.
--- Written by Nick Cawley, Analyst
To contact Nick, email him at nicholas.cawley@ig.com
Follow Nick on Twitter @nickcawley1


