Oil Price Analysis and News
- API Crude Oil Inventory reports shows surprise build
- US-China Trade War Escalation Continues to Weigh on Sentiment
- Potential Peace Talks on Red Sea
For a more in-depth analysis on Oil Prices, check out the Q3 Forecast for Oil
Crude Oil Futures Fall on API
Brent and WTI crude futures are down over 1% breaking below $74 and $68 respectively. One of the reasons for soft oil prices was due to yesterday’s API crude oil inventory report, which showed a surprise build in crude stocks of 5.6mbpd vs. Exp. -2.8mbpd. Consequently, this provides an indication as to how the DoE crude oil inventory report may take shape, which is scheduled for release at 1430GMT.
Chinese Outlook Weakening Amid Increased Trade Tensions
Overnight, China's manufacturing sector grew at the slowest pace since November 2017 as export orders declined yet again in sign of a worsening outlook for the Chinese economy and businesses amid the ongoing trade war tensions between China and the US. The Caixin Manufacturing PMI fell to 50.8 in July from 51 in the prior month. Alongside this, latest reports suggested that the US will place tariffs of 25% as opposed to 10% against $200bln worth of Chinese goods, which in turn has dampened the sentiment for risky assets including oil prices.
Reduced Tensions on the Red Sea
Another factor for lower oil prices is due to the de-escalation of tensions in the Red Sea. Yemen’s Houthi rebels stated that they would stop attacks in the Red Sea for two weeks from 2000GMT today to support peace efforts. This comes days after Saudi Arabia had stopped oil exports through the Bab al-Mandeb strait after two crude tankers had been attacked. If indeed talks are somewhat successful this could potentially allow for crude tankers to resume activity through the strait, in which 4.8mbpd of crude products are typically shipped.
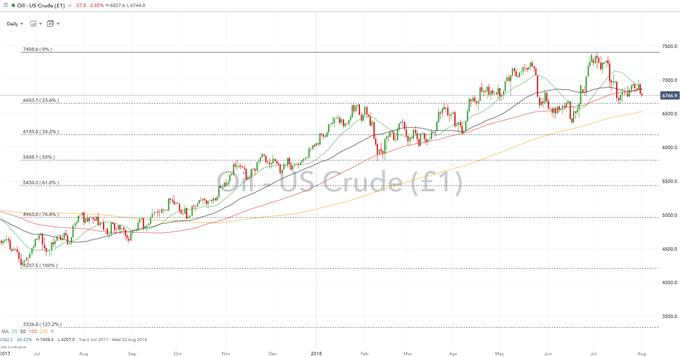
OIL PRICE CHART: Daily Time-Frame (June 2017-August 2018)

In the near term, firm support is situated at the $66.53 which marks the 23.6% Fibonacci retracement of the rise from $42.07-74.08, while support in the longer term is at the 200DMA at $65.30. On the topside, a cluster of DMAs (50 and 100DMA) around $68.60 looks to potentially cap price action on the upside.
What Does Current IG Client Positioning Suggest About the Next Move in Crude Oil?
Data shows 62.7% of traders are net-long with the ratio of traders long to short at 1.68 to 1. In fact, traders have remained net-long since Jul 11 when Oil - US Crude traded near 7240.4; price has moved 6.4% lower since then. The number of traders net-long is 5.4% higher than yesterday and 3.9% lower from last week, while the number of traders net-short is 11.1% lower than yesterday and 6.9% lower from last week.
We typically take a contrarian view to crowd sentiment, and the fact traders are net-long suggests Oil - US Crude prices may continue to fall. Traders are further net-long than yesterday and last week, and the combination of current sentiment and recent changes gives us a stronger Oil - US Crude-bearish contrarian trading bias.
--- Written by Justin McQueen, Market Analyst
To contact Justin, email him at Justin.mcqueen@ig.com
Follow Justin on Twitter @JMcQueenFX


