


Bitcoin (BTC) and Ripple (XRP): Prices, Charts and Analysis
- Bitcoin rallies as ETF chatter grows louder.
- Ripple unable to break higher as classification worries persist.
Bitcoin (BTC) – Clients 78.3% net-long/positional changes show bullish bias.
Ripple (XRP) – Clients 97.1% net-long/positional changes show bullish bias.
Bitcoin (BTC) Rallies on ETF Expectations
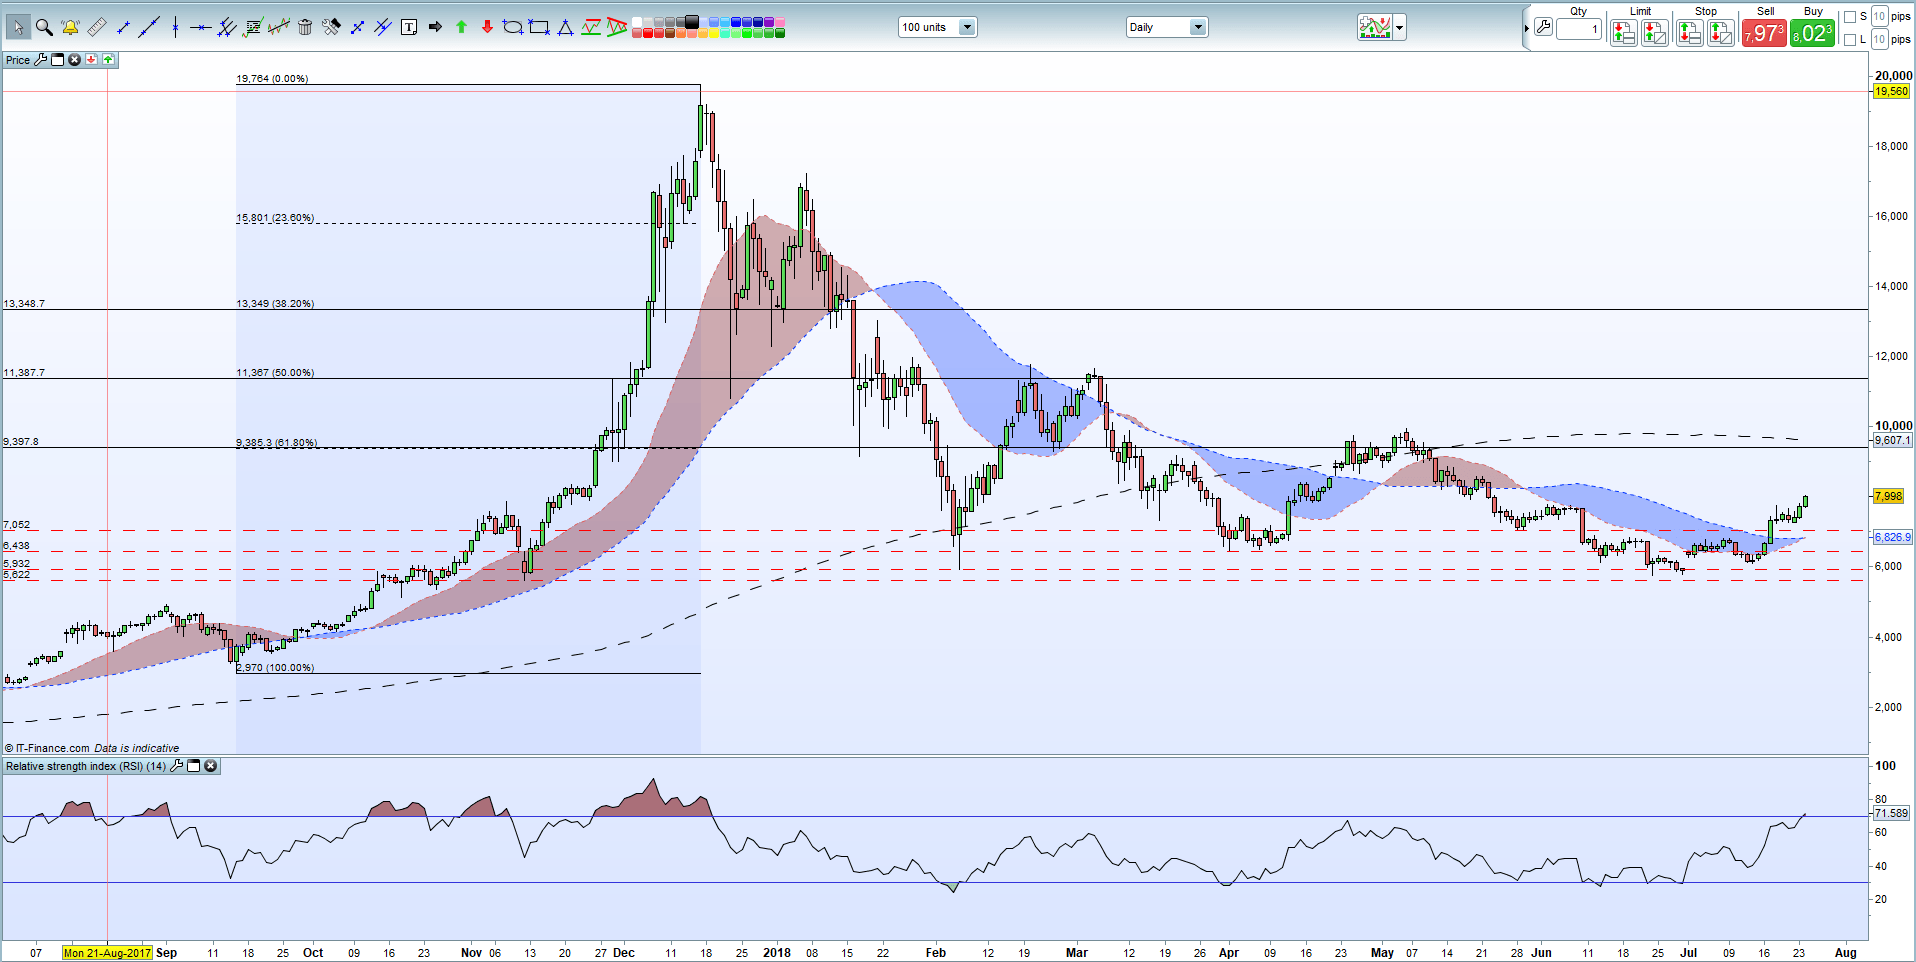
Bitcoin (BTC) has burst back above $8,000 for the first time since late-May as rumors that an ETF will be granted soon drives the price higher. According to market news, the US SEC is seriously considering whether to approve an application for a Bitcoin ETF with news on the ruling expected within a month. An openly traded ETF will allow investors to trade Bitcoin, from either a long or short position, adding liquidity and allure to the cryptocurrency. Van Eck Associates and SolidX Partners have filed a request with the SEC to list a physically-backed Bitcoin ETF. Earlier this year the SEC rejected a filing for the Winklevoss Bitcoin Trust ETF.
The latest rally – BTC is up around 30% since July 13 – has taken out a raft of resistance levels on the chart and leaves the way open for higher prices in the short-term. A small double top in late May at $8,600 is the first target before 61.8% Fibonacci retracement at $9,385 and the 200-day moving average at $9,640 come into play. Support at $7,052 should be robust. Bitcoin now accounts for 46.7% of the market, up from mid-30% in May.
Bitcoin (BTC) Daily Price Chart (September 2017 – July 16, 2018)
Ripple (XRP) – The Struggle Continues
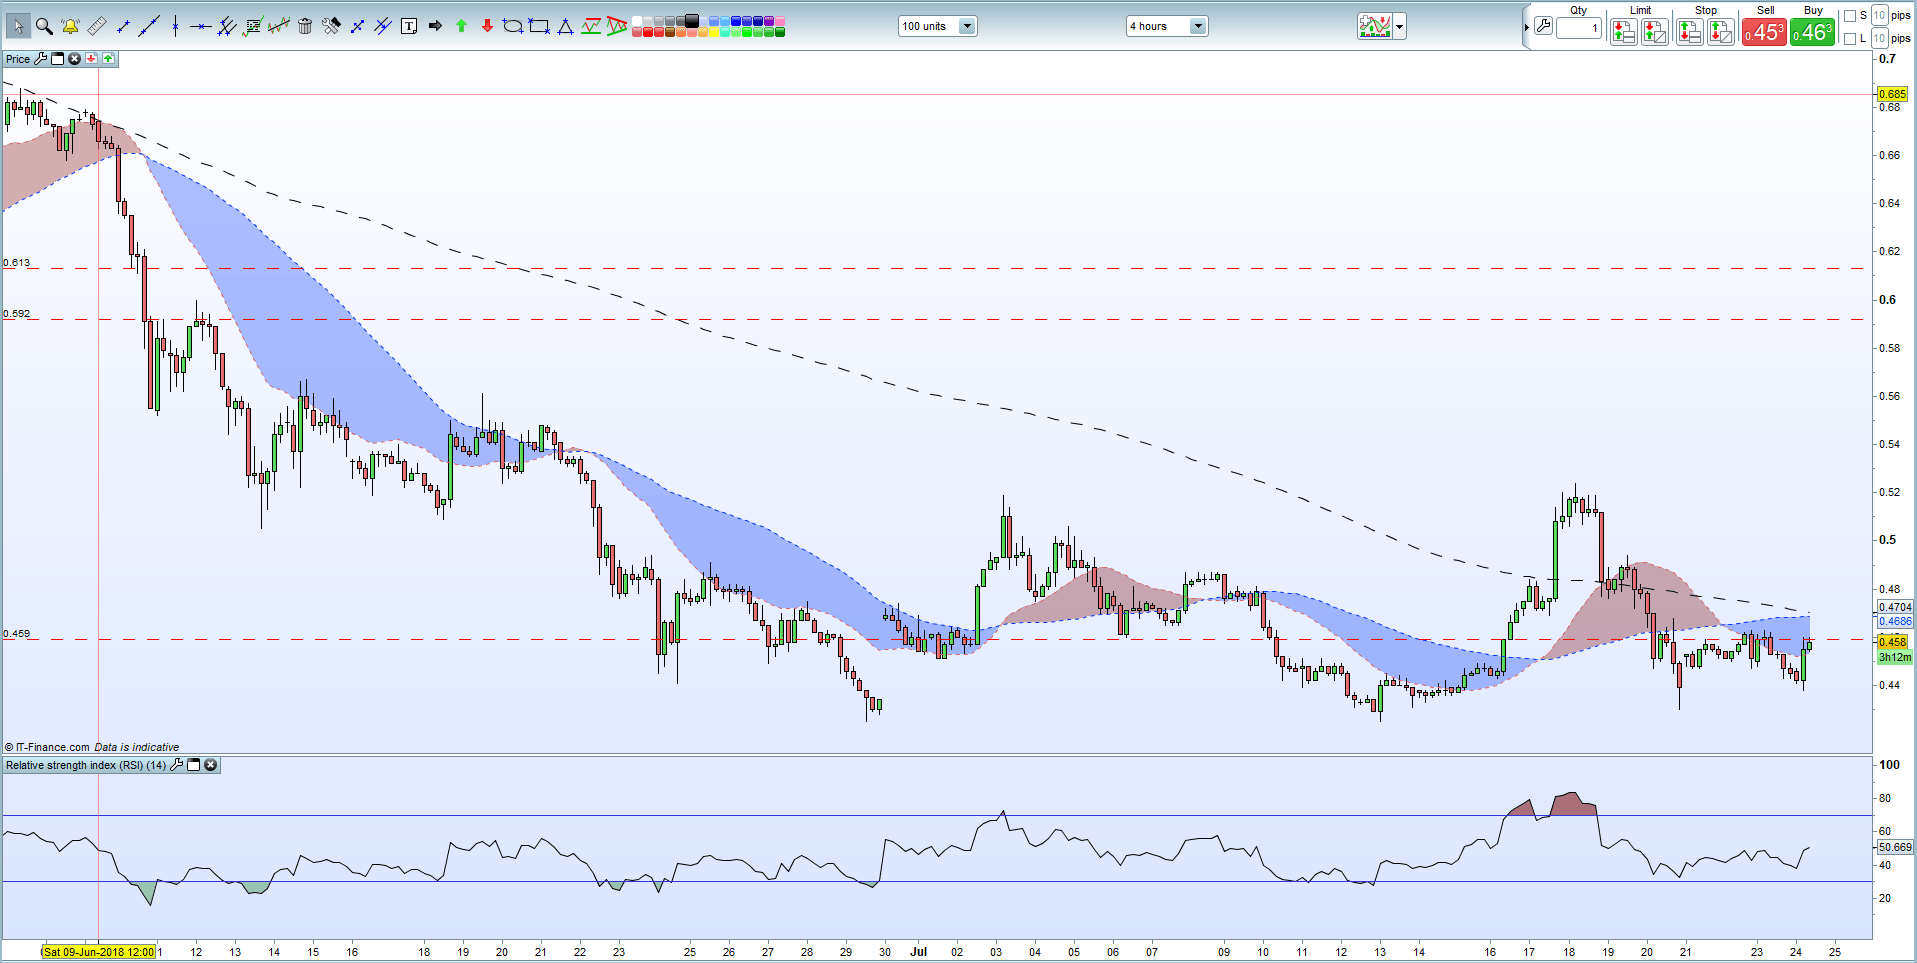
The third-largest cryptocurrency by market capitalisation is unable to cash in on the latest cryptocurrency rally and continues to trade around $0.45 as buyers take a step back. The fear for Ripple holders is that the token may soon be classified as a security by the SEC which would then make it unattractive for unregulated exchanges to list XRP.
Ripple is currently trading either side of $0.46 – support seen back in April – and will likely break to the downside further if the recent double-low at $0.425 is taken out. XRP continues to trade below its 200-day moving average and is now being press further lower by the 20- and 50-day ma.
Ripple Four Hour Price Chart (June 7 – July 24, 2018)
We cover Bitcoin, Ripple and a range of other cryptocurrencies, at our Weekly Cryptocurrency Webinar on Wednesday.
What are your views on Bitcoin and Ripple - you can contact me on Twitter @nickcawley1 or via email at nicholas.cawley@ig.com.
--- Written by Nick Cawley, Analyst.


