


USD and Gold Price, News and Technical Analysis
- Expectations of a strong Q2 GDP reading will underpin the greenback in the days ahead.
- Gold may struggle to break the downtrend.
The DailyFX Q3 Forecasts have just been released and cover all the major asset classes.
US Dollar May Re-Test Highs on Strong Q2 GDP
The first look at US Q2 GDP on Friday is the main data release of the week and is likely to give the US dollar a decent boost and confirm a 0.25% rate hike at the next FOMC meeting. The greenback has been sold-off over the last 3-4 days after US President Donald Trump raised the bar in the latest trade spat with China, threatening tariffs on over $500 billion of Chinese goods. The President then doubled down on the greenback, saying that the US currency is too strong – and the Yuan and Euro are too weak – and that the strong USD is hurting the economy.
This week’s GDP release is likely to show a robust pace of expansion in the US with estimates for Q2 growth now seen between 4% and 5%.
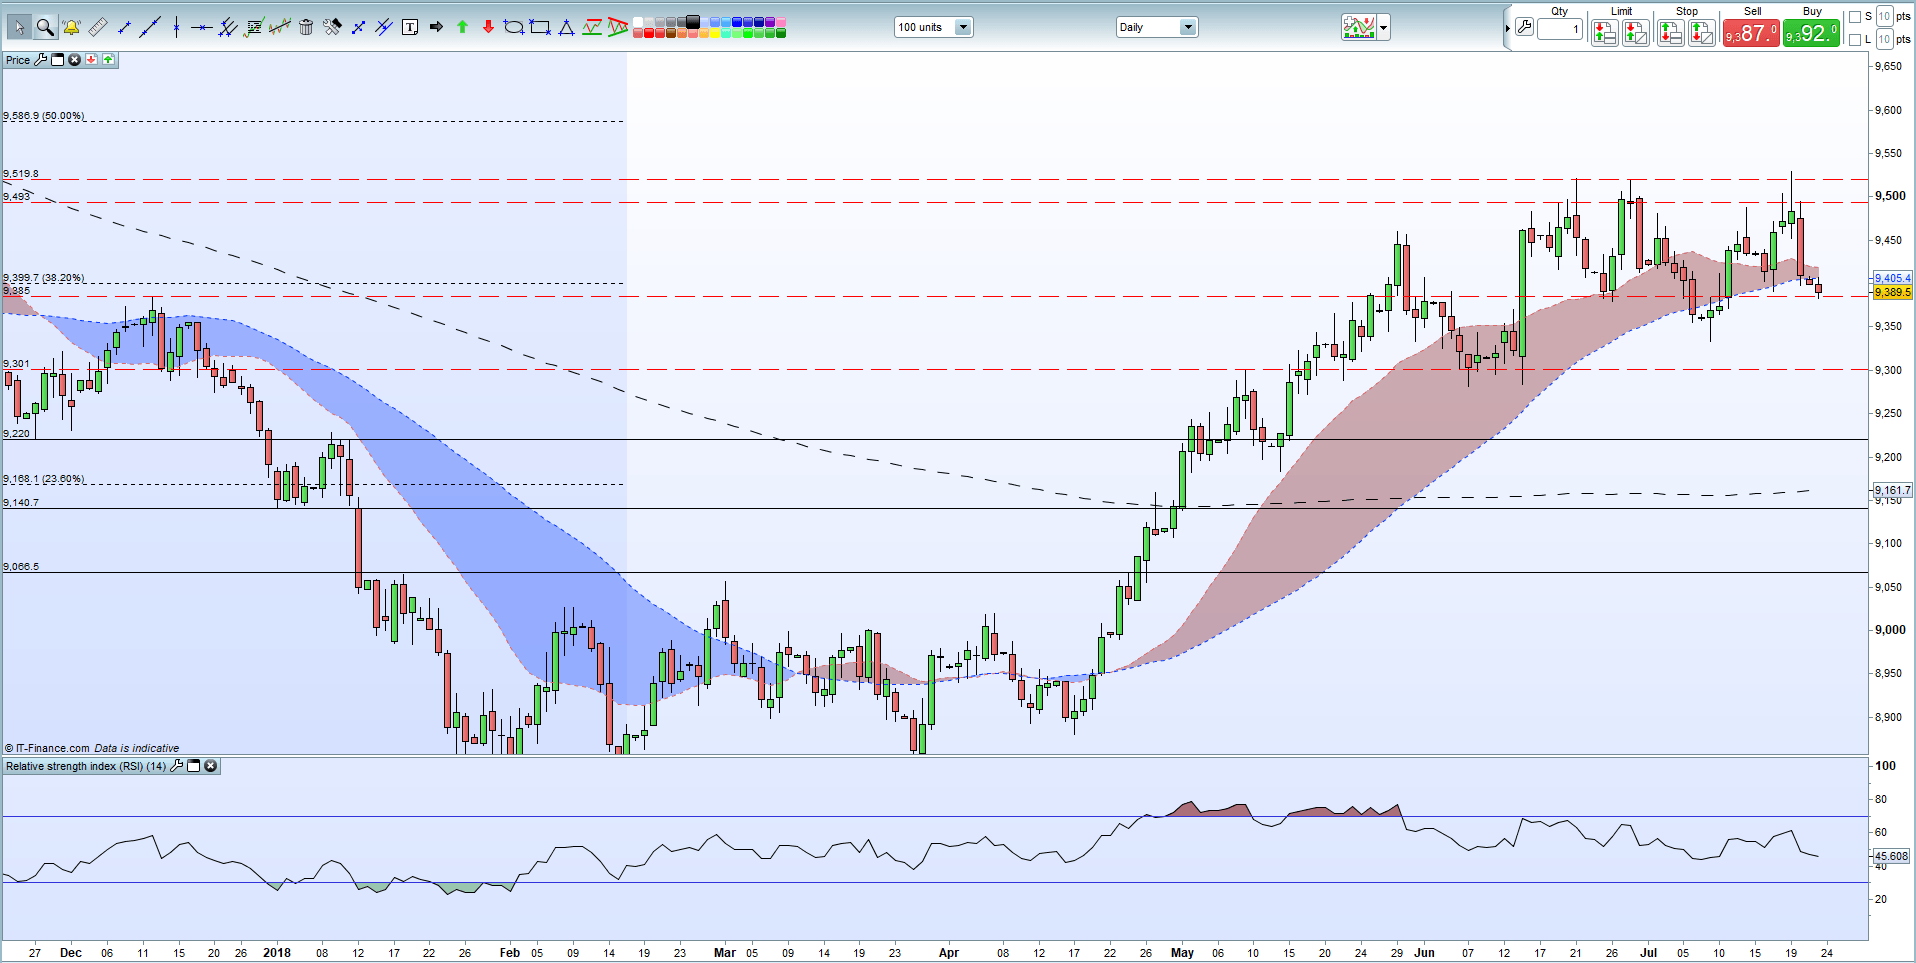
The US Dollar is expected to remain relatively well supported ahead of Friday’s number with support seen between 93.00 and 93.33 (July 9 low). Resistance at 93.99 should not prove difficult to overcome which would leave DXY with a clear run at the 95.20 June double top.
US Dollar Index (DXY) Daily Price Chart (November 27, 2017 – July 23, 2018)
Gold Rally Likely to Stall Unless Trend is Broken
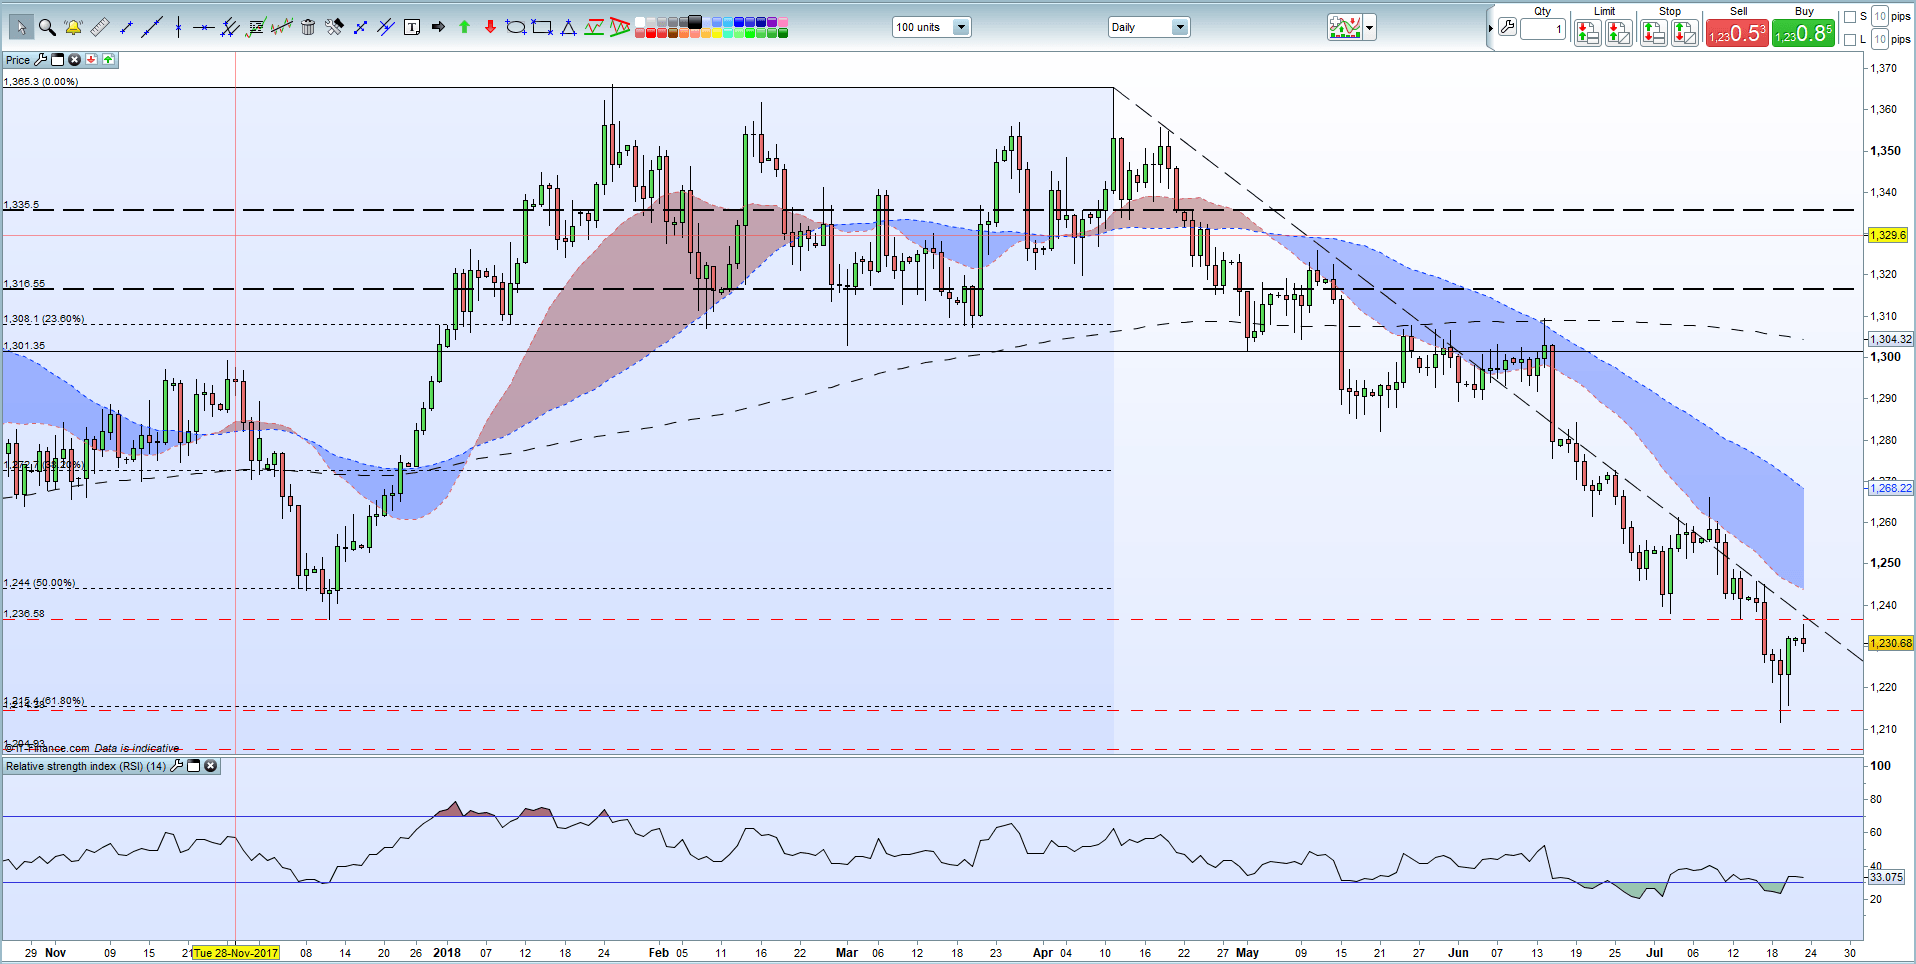
The US dollar sell-off, and the rise in risk-off sentiment, has boosted gold from a low around $1,210/oz. to a current level of $1,230/oz. Despite the uplift, the outlook for gold remins negative while it continues to respect the downtrend from the April 11 high. The precious metal also trades below all thre moving averages and has just climbed out of oversold terrritory according to the RSI indicator. Higher US rates will continue to weigh on gold – the 2-year US Treasury currently trades with a near decade high yield on 2.60% - will gold’s correlation to the Chinese Yuan continues. The precious metal will need to make a decisive break above the $1,236 - $1,238/oz. level to overcome the downtrend, while further upside gains will be limited unless risk-off sentiment ratchets higher.
IG Client Sentiment data shows 87.0% of traders are net-long gold with the ratio of traders long to short at 6.72 to 1.
Gold Daily Price Chart (October 25, 2017 – July 23, 2018)
If you are new to foreign exchange, or if you would like to update your knowledge base, download our New to FX Guide and our Traits of Successful Traders to help you on your journey.
What’s your opinion on the US dollar and gold? Share your thoughts with us using the comments section at the end of the article or you can contact the author via email at Nicholas.cawley@ig.com or via Twitter @nickcawley1
--- Written by Nick Cawley, Analyst


