


Crude Oil Price Analysis
- Brent crude looks oversold in the short-term but support needs to hold to prevent further losses.
- RSI indicator and 200-day moving average may underpin oil.
The DailyFX Q3 Trading Forecasts for all major currencies, commodities and indices, are availableto download to help you make more informed trading decisions.
Oil Looks Weak but Support May be on Hand
Brent crude has had a tough couple of months after hitting a three-and-a-half year high in late May. A combination of a strong US dollar and fears over a slowdown in China have weighed heavily, while recent talk of production increases led the last, sharp, leg lower. From a technical perspective the two ‘double tops’ around $80.40/bbl. in May and $79.50/bbl. in late June may cap any further upside in the medium-term, while the spot price still trades below the 20- and 50-day moving averages.
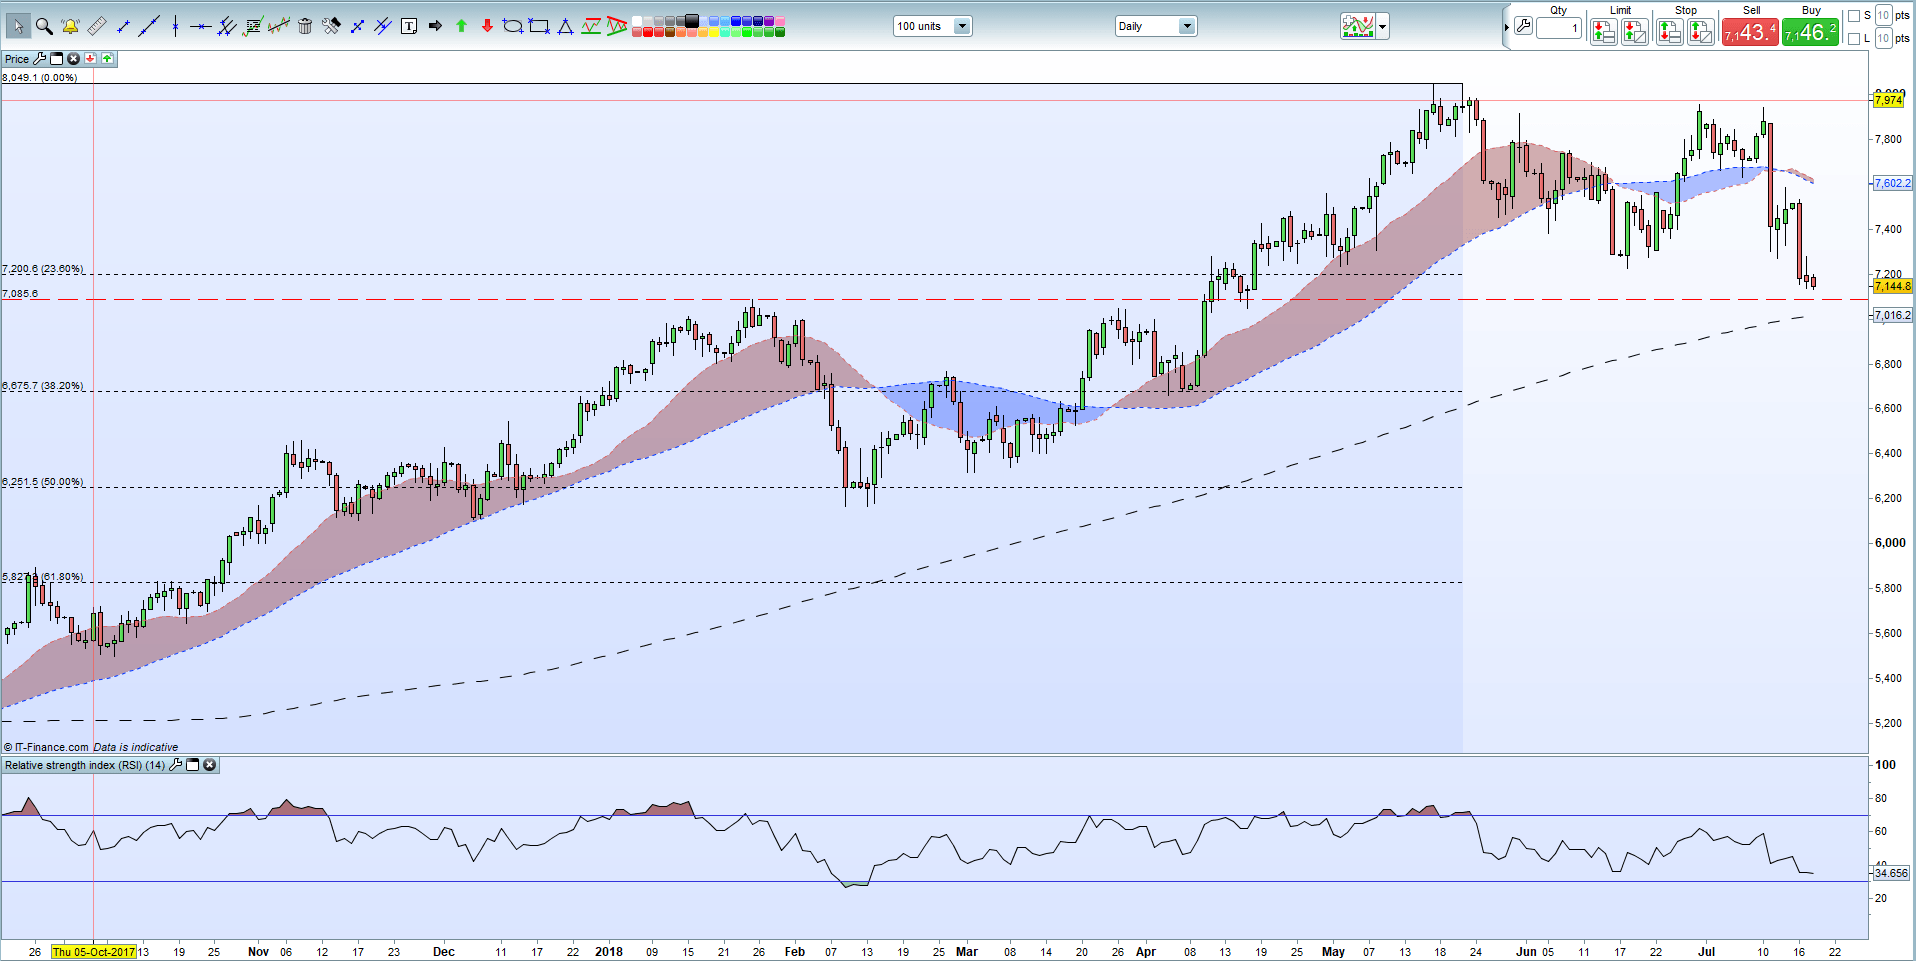
On the positive side, Brent still trades above its 200-day moving average while the RSI indicator is at a five-month low and nears oversold territory.
The January 25 swing high at $70.85/bbl. should provide the first level of support with the 200-day moving average, currently at $70.06/bbl. reinforcing this level. A break and close below these levels would leave oil vulnerable to another move lower towards the 38.2% Fibonacci retracement level at $66.75/bbl.
On the upside, $72.00/bbl. needs to be cleared to open the way for a renewed push higher.
The latest IG Client Sentiment Indicator shows how retail are positioned in Oil and a wide variety of other financial markets.
Brent Oil Daily Price Chart (September 2017 – July 18, 2018)
If you are new to foreign exchange, or if you would like to update your knowledge base, download our New to FX Guide and our Traits of Successful Traders to help you on your journey.
What’s your opinion on the Oil? Share your thoughts with us using the comments section at the end of the article or you can contact the author via email at Nicholas.cawley@ig.com or via Twitter @nickcawley1
--- Written by Nick Cawley, Analyst


