Gold Price News and Analysis
- Two-month downtrend looks ominous for gold bulls.
- Risk aversion may provide a bulwark against further sharp losses.
The DailyFX Q2 Gold Forecast is now available to help traders navigate the market.
The latest IG Retail Sentiment Indicator shows that traders are 84.4% net-long of the precious metal but recent changes in net-longs gives us a mixed spot gold trading bias.
Spot Gold Price Determined by Fundamental Drivers
Gold has fallen sharply by nearly $100/oz. over the last two months as higher US interest rates weigh on the non-interest bearing asset. With US interest rates expected to be hiked by another 0.50% in 2019 – via two 0.25% increments – the fundamental pressure on the precious metal from tightening US monetary policy is unlikely to ease any time in the future. Counter-balancing this negative headwind, gold’s value as a safe-haven asset in times of market turmoil has yet to be seen and may well come to the fore in the short-term. The escalation in the US-China trade war dispute has not yet reached its zenith with US President Trump promising further tariffs on Chinese imports, while Beijing refuses to buckle and has pledged counter-measures of its own on American goods.
Global Trade War Primers and Infographics:
US China Trade War & a Brief History of Trade Wars – 1900 until Present
A War to Trade More, Not Less - What’s Behind US-China Tariffs
Gold Downtrend Remains in Play
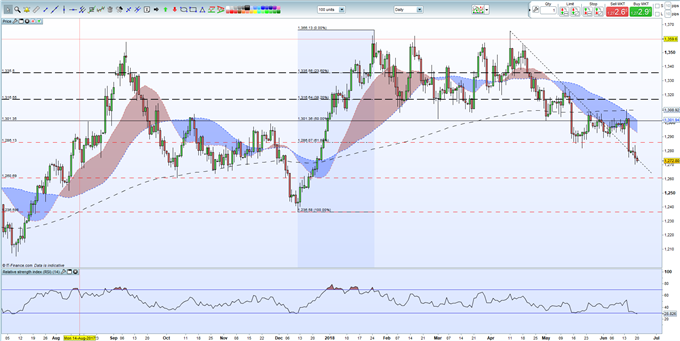
The daily gold chart shows the recent downtrend from the April 11 high continues to be respected and likely points to further falls ahead. The Fibonacci retracement at $1,286/oz. was broken and now turns to short-term resistance with the October 6 swing low at $1,260/oz. the next downside target. If this level is broken convincingly, a retrace back to the December 12 low print at $1,236/oz. is the bears next target.
Gold Spot Price Chart Daily Time Frame (July 2017 – June 20, 2018)

Are you new to Gold or FX trading or are you looking to improve your trading skill sets? We can help you along your journey with a comprehensive range of constantly updated guides and trading tools – they are all Free to Download Here.
What’s your opinion on Gold?Share your thoughts with us using the comments section at the end of the article or you can contact the author via email at nicholas.cawley@ig.com or via Twitter @nickcawley1.
--- Written by Nick Cawley, Analyst


