


NIKKEI 225 TECHNICAL ANALYSIS TALKING POINTS:
- The Nikkei 225 remains in retreat from its most recent significant high
- However, its fall has found what looks like quite solid support at a key retracement level
- Bulls will need to act quickly, however, to try the current range top
Trade all major Japanese economic data live and interactive at the DailyFX Webinars.
The Nikkei 225’s fall from its most recent high has found support at an interesting level.
The Tokyo equity benchmark seems to have peaked at the 23044 reached on May 21 and has certainly meandered lower since. However, the fall was arrested this week at 21993. That is the exact, 38.2% Fibonacci retracement of the rise up from the lows of late March to that May peak.
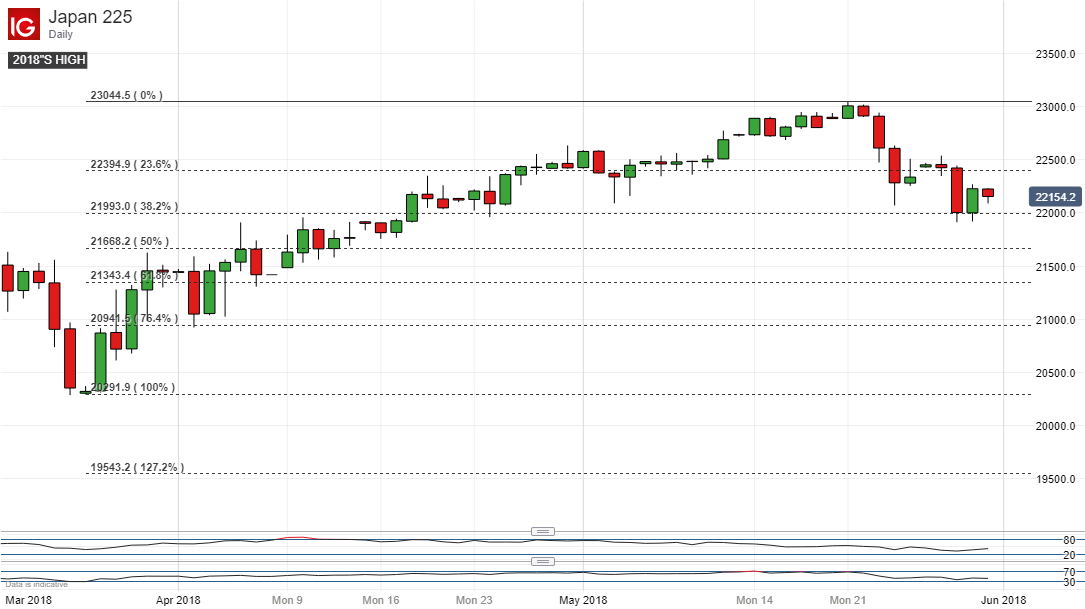
It’s probably still wise to be cautious though. That retracement point has held for only two days at the time of writing- even if it looks quite solid. A weekly close above it would certainly help nail down the idea that the sellers have met their match here.
Still, even if we see that, Nikkei bulls will have their work cut out to conclusively break the current range top.
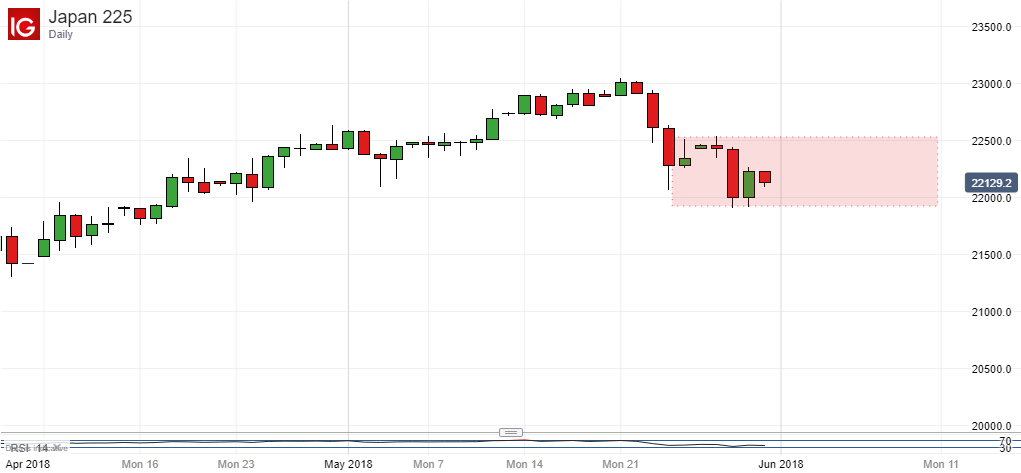
That comes in more than 300 points above the current market at 22529 and it will have to be overcome if the index is to revisit its recent peak and, possibly, push on higher. This looks like a tall order at present with the index exhibiting a clear preference for the range’s lower reaches.
If the support they provide does give way, the next key retracement level is the 50% Fibonacci, currently at 21668. Be warned however that another visit to that low would mean that a cluster of support levels from early March in the 21700 region had given way.
All up ,the index looks biased to the downside but the bulls can retain a little hop as long as that key 21993 level holds. The uncommitted could be well-advised to wait and see now whether it can still do so into the end of Friday’s Japanese trading session.
If it can then a trial of the range top could be in the cards for next week.
RESOURCES FOR TRADERS
Whether you’re new to trading or an old hand DailyFX has plenty of resources to help you. There’s our trading sentiment indicator which shows you live how IG clients are positioned right now. We also hold educational and analytical webinars and offer trading guides, with one specifically aimed at those new to foreign exchange markets. There’s also a Bitcoin guide. Be sure to make the most of them all. They were written by our seasoned trading experts and they’re all free.
--- Written by David Cottle, DailyFX Research
Follow David on Twitter @DavidCottleFX or use the Comments section below to get in touch!


