


News and Talking Points - Bitcoin, Ripple, Ether, Litecoin
- Talk that the US Justice Department is investing illegal practices in the cryptocurrency market.
- Charts continue to look negative and fresh 2018 lows beckon.
Another bad week in the crypto-space with the market currently over $50 billion lower from its high print on Monday. The sell-off has been gradual and constant on low market volume with prices homing in on their 2018 lows. Unconfirmed news that the US Justice Department was looking at illegal market practices in the crypto-space - including spoofing and wash trades - sent the market lower with little in the way of technical support to cushion the falls. The report followed a statement by the US SEC applauding police efforts to police fraud in the ICO market.
Bitcoin Heading for Range Lows
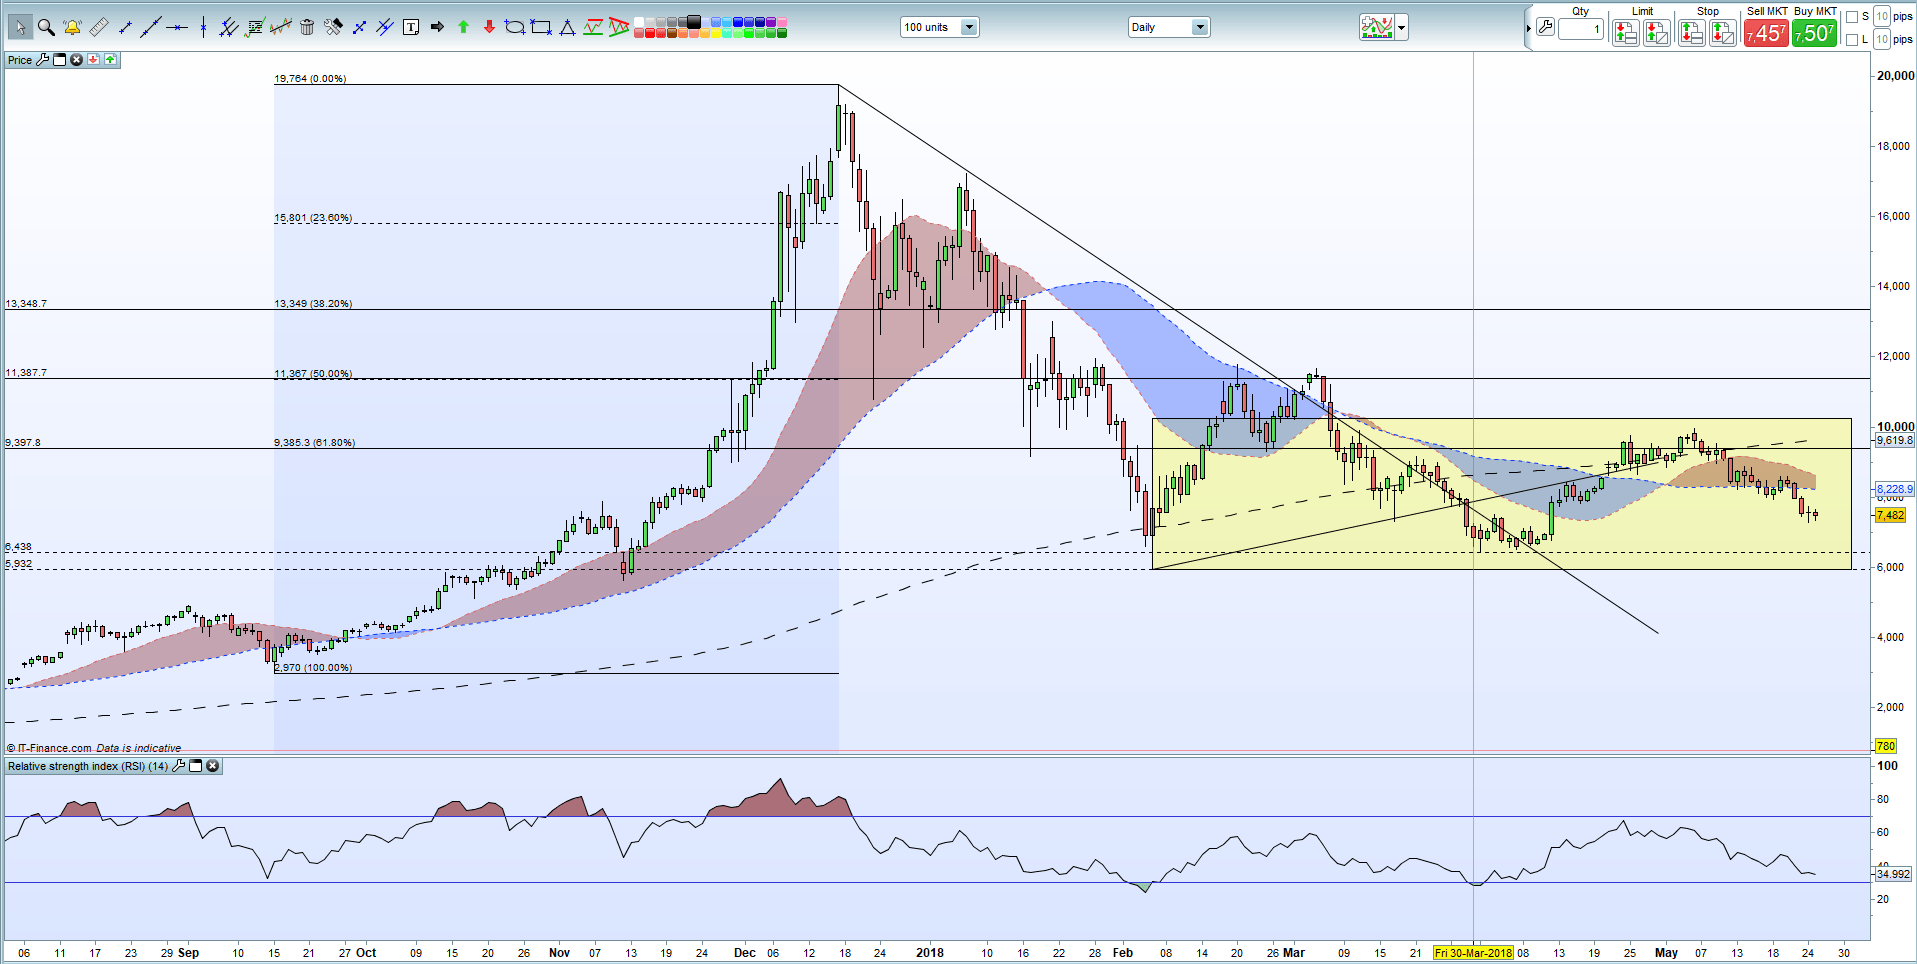
The chart below shows how BTC has been stuck in a range over the last two-and-a-half months and has more room to the downside. The late March low at $6,438 is the first target ahead of the February 6 and the 2018 low of $5,932. The 20-day/50-day cloud above the around $8,200 to $8,600 should prove stiff resistance to any upside move.
Bitcoin (BTC) Daily Price Chart in US Dollars (August 4, 2017 - May 25, 2018)
Ripple Stuck Around $0.60
XRP is having difficulty moving back of its recent low with any rally met with further selling pressure. The $0.60 price is produced by a gap on the April 12 candle on the four-hour chart. With the gap filled and no retracement, Ripple is likely to fall further with the April double low at $0.459 the first meaningful target. On the upside $0.63 followed by $0.705.
Ripple (XRP) Four Hour Price Chart in US Dollars (March 22, 2017 – May 25, 2018)

Ethereum Capped by 200-day Moving Average
The second largest digital currency is struggling to break back above the 200-day moving average, currently at $634, and has traded back below $600 this week. On the downside, $567 is the first level of support ahead of the December 22 low at $497. On the upside $637 ahead of $670 and $700.
Ethereum (ETH)Daily Price Chart in US Dollars (2018)

Litecoin Downtrend Remains
Litecoin continues to probe lower with the cluster of lows between $109.6 and $111.5 the next support/target level. This level has proved resilient in the past and may provide a spring bboard for a short-term rally back to $136 ahead of $153.
Litecoin (LTC) Four Hour Price Chart in US Dollars (March 22 – May 25, 2018)

Essential Cryptocurrency Trader Resources
If you are interested in trading Bitcoin, Ripple, Ether or Litecoin we can offer you a an informative Introduction to Bitcoin Trading Guide.
What’s your view of the cryptocurrency market – oversold or overbought?
You can leave your comments in the section below or you can contact the author by email at nicholas.cawley@ig.com or via Twitter @nickcawley1.
--- Written by Nick Cawley, Analyst.


