


USD Analysis and Talking Points
- US Treasury yields point to further USD strength.
- Any slip back in USD strength should be temporary.
Check out our new Trading Guides: they’re free and have been updated for the second quarter of 2018.
IG Client Sentiment data show traders are long of EUR and GBP against the USD although recent changes show these positions are being pared back. Download the data for free and see how recent positional changes can affect client sentiment.
USD Likely to Rally Further as US Treasury Yields Provide Underlying Support
The US Dollar Index (DXY) continues to march higher, touching levels last seen in late December 2017. The recent rally is again being fueled by ever higher US Treasury yields, with a wide range of USTs hitting multi-year yield highs. The 2-year UST is offered with a yield of 2.52%, a near decade high, while the closely followed 10-year UST is a couple of basis points above 3.0%. And traders who are looking for yield should note that the 7-year UST is currently trading at 2.960%, a high last seen eight years ago.
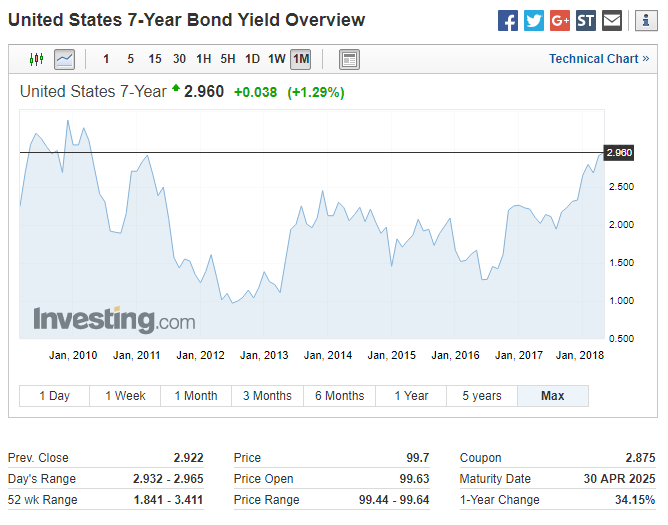
The DXY should find fresh support from these yield levels if historic data is taken into account. The 7-year UST traded with a yield around 1.95% on August 1, 2017 while at the same time the DXY was changing hands at 93.00, just below the level it is quoted at now.
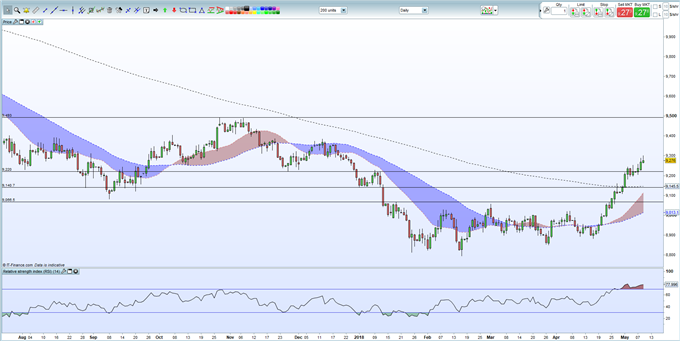
The daily DXY chart shows that while there may be a temporary pull-back – the RSI is in extreme overbought territory – the index is comfortably above the 200-day moving average and continues to respect the sharp uptrend started mid-April. The November 27 swing low at 92.20 should provide strong support with the 200-day moving average around 91.50 unlikely to be threatened in the short-term. On the upside there is still room to move to 93.85 ahead of the October 27 high at 94.93.
The DXY is also benefitting from a weak EUR complex – the EUR is the largest constituent of the DXY at around 56% - while GBP continues to slip lower as UK rate hikes are taken off the table. And looking ahead US CPI, to be released on Thursday, may show price pressures increasing faster than currently expected, cementing a total of four US rate hikes this year.
US Dollar Index (DXY) Daily Price Chart (July 23, 2017 – May 9, 2018)
Would you like to know the Number One Mistake Traders Make? – Download our free guide to find out.
If you have questions or comments on this article, you can leave them in the section below, or you can contact the author via email at Nicholas.cawley@ig.com or via Twitter @nickcawley1.
--- Written by Nick Cawley, Analyst


