


Gold Price News and Analysis
- Gold price falters just above the 200-day moving average.
- Prices may get support if US President Trump plays hardball with Iran.
The new DailyFX Q2 Gold Forecast is now available to help traders navigate the market.
The latest IG Retail Sentiment Indicator shows that traders are heavily long of spot gold, although recent long-short positioning has changed.
Gold Price May Close Below The 200-Day Moving Average; Bearish Set-Up
Gold continues to push to the downside on a combination of hawkish Fed speak and in anticipation of higher US Treasury yields going forward. Spot gold is also re-testing the 200-day moving average, a sign of lower prices ahead.
The US Dollar Index (DXY) is currently trading at a near five-month high on a combination of higher US Treasury yields and a weak EUR. The index is changing hands at 92.88 (+0.54%), four points higher than levels last seen on April 17and is targeting the December 12 swing high at 93.85. Last week’s hawkish FOMC continues to embolden USD bulls while the US Treasury space offers ever higher yields. While the benchmark 10-year UST may currently trade just below 3%, the 2-year offers 2.51% and the 5-year offers 2.81%, a nine-and-a-half year high.
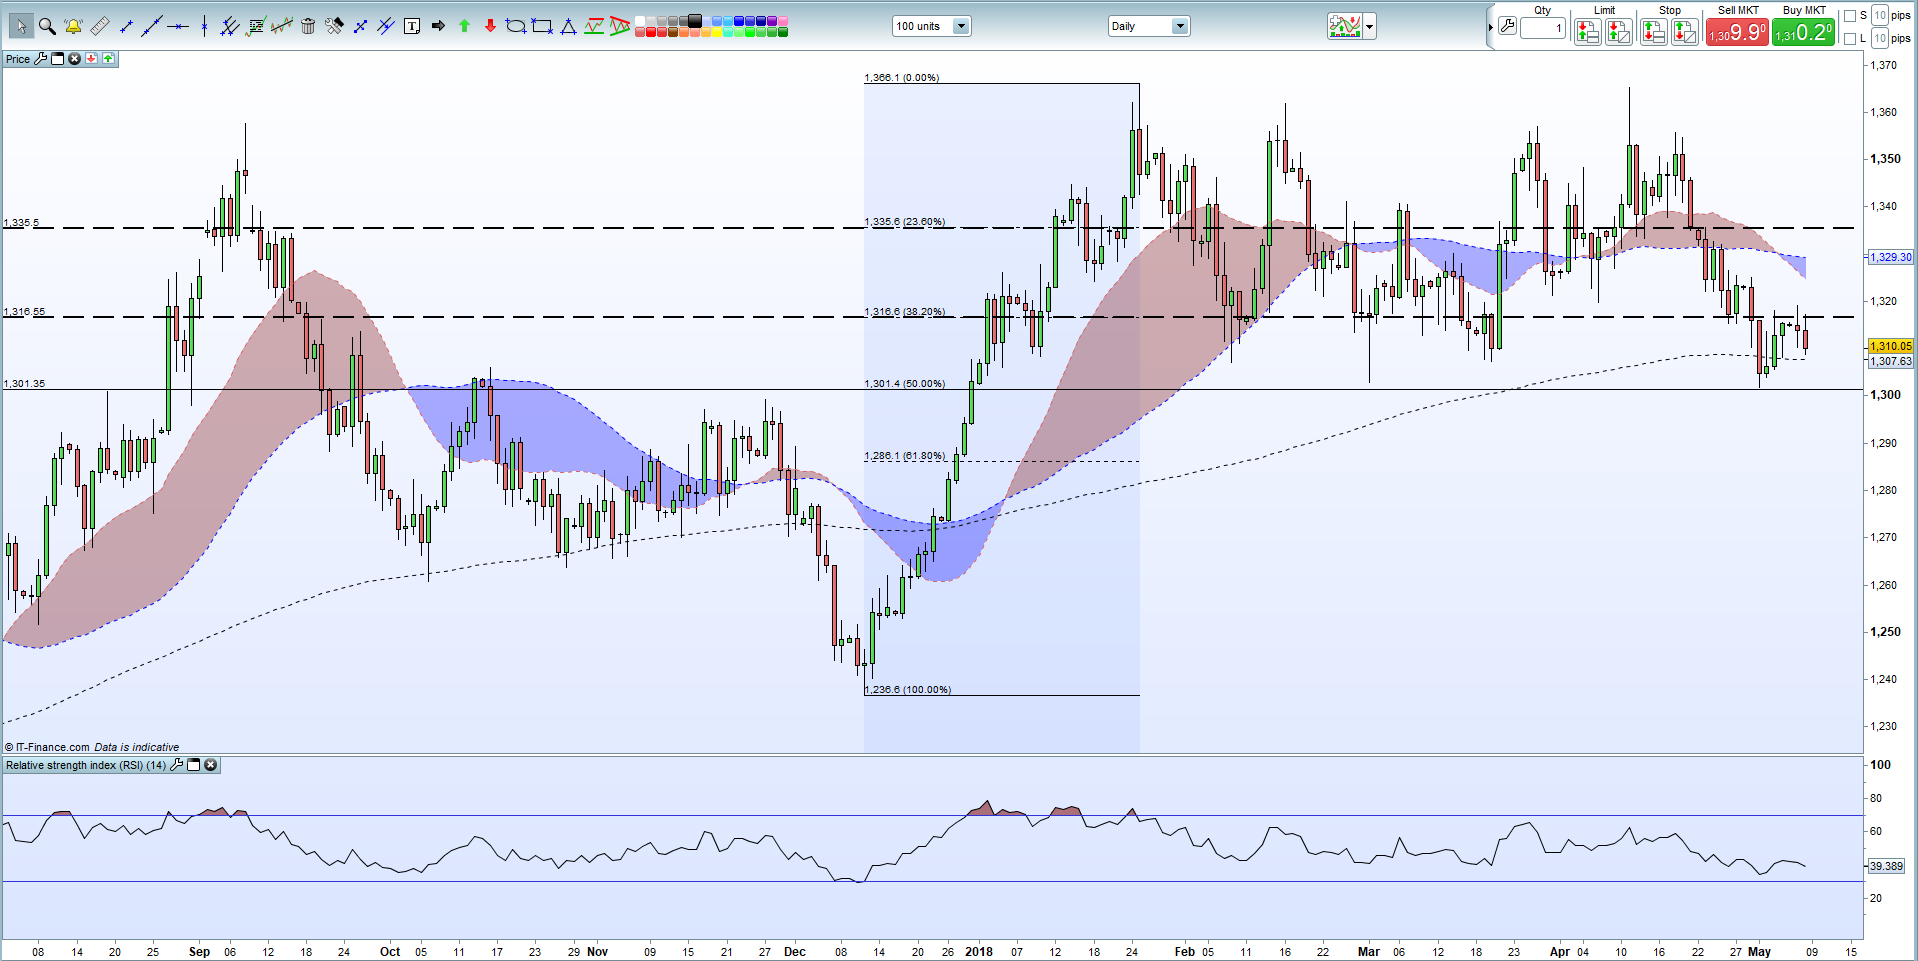
On the charts, spot gold is currently sitting on top of the 200-day moving average and is set to break lower. While the 200-day ma has already been broken, gold has not closed below this level yet this year. A comprehensive break and close lower would bring the 50% Fibonacci level at $1,301.4 into play ahead of $1,300/oz and then $1,286.1/oz.
Bullish support for gold may come from US President Trump as he decides whether or not to abandon the Iran nuclear deal and to reimpose sanctions.
Gold Spot Price Chart Daily Time Frame (August 3, 2017 – May 8, 2018)
Are you new to Gold or FX trading or are you looking to improve your trading skill sets? We can help you along your journey with a comprehensive range of constantly updated guides and trading tools – they are all Free to Download Here.
What’s your opinion on Gold?Share your thoughts with us using the comments section at the end of the article or you can contact the author via email at nicholas.cawley@ig.com or via Twitter @nickcawley1.
--- Written by Nick Cawley, Analyst


