


Ethereum News and Talking Points
- Ethereum chart set-up points to further downside.
- Near-term support missing.
Ethereum Chart Hints at Lower Prices
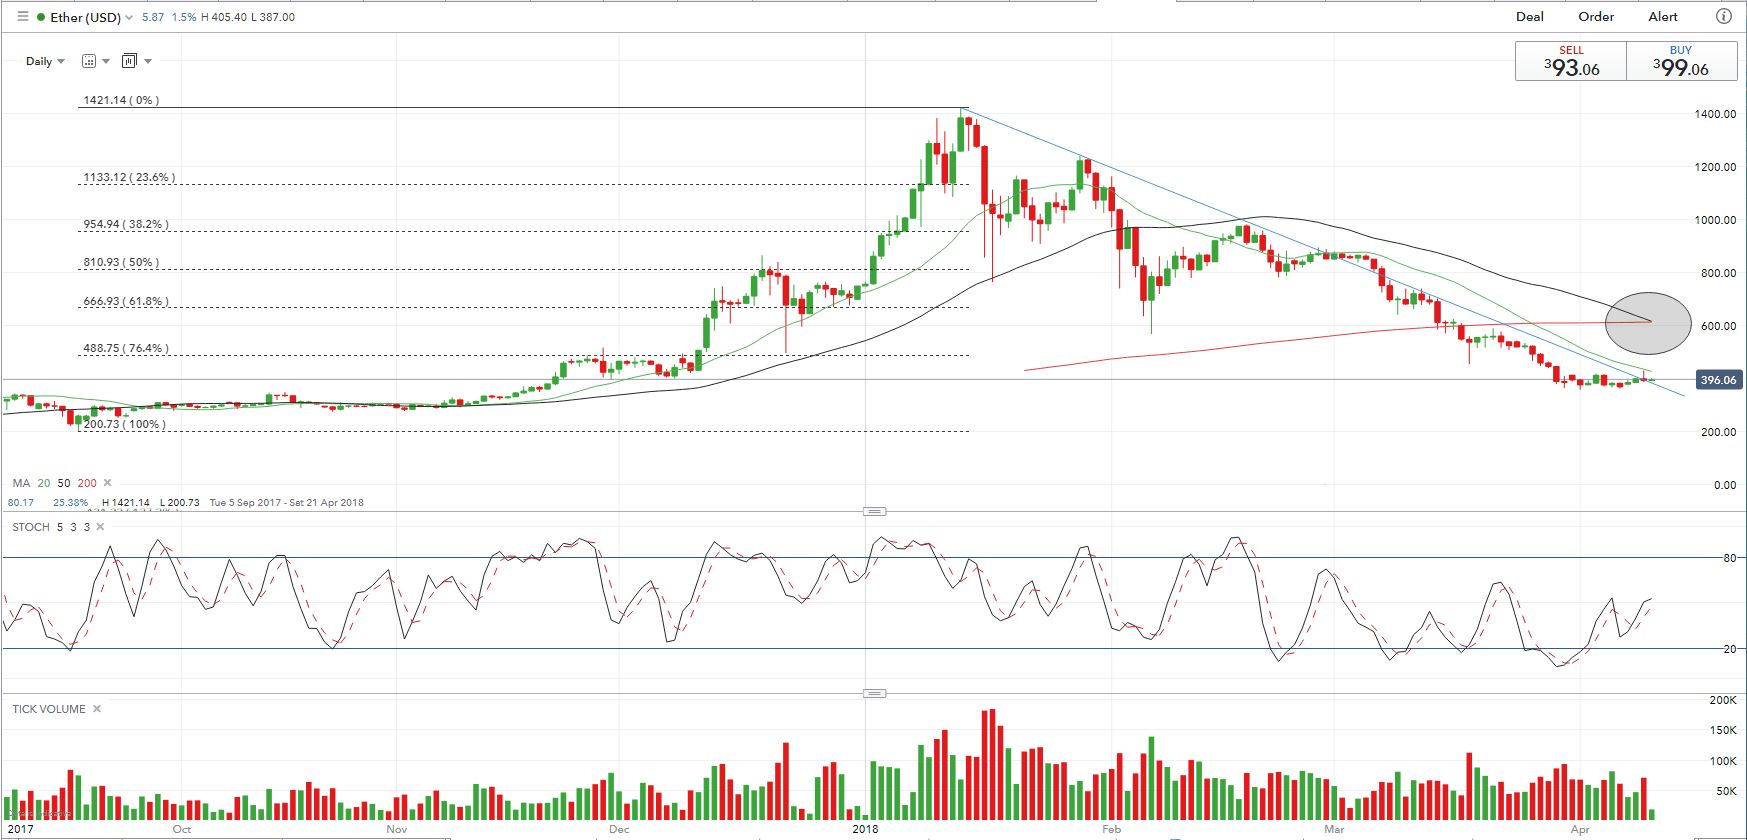
The recent sharp down trend for the second largest cryptocurrency Ethereum looks set to push the 50-day moving average down through the 200-day moving average, a technical set-up known as a bearish- or death-cross. The cross-over is normally confirmed with higher volume – not the case with ETH – and highlights a decline in short-term momentum. While ETH has already fallen by over $1,000 to a current level of $394, the cross-over may indicate that bearish sentiment remains and that lower prices may follow.
ETH is currently respecting its down trend channel from the January 13 high at $1,421 although the token is currently trying to break to the upside. The charts shows that ETH had a false break above the trend line in early March before falling back below trend for the last five weeks.
Bitcoin (BTC) experienced its own 50-/200-day ma cross-over in late March when the token was trading around $7,500 compared to a current level of $6,720.
We discuss a range of cryptocurrency charts and price set-ups at our Weekly Cryptocurrency Webinar every (Wednesday) at 12:00.
Ethereum (ETH) Price Chart in US Dollars(September 7, 2017 – April 10, 2018)
Cryptocurrency Trader Resources
If you are interested in trading Bitcoin, Bitcoin Cash or Ethereum check out our Introduction to Bitcoin Trading Guide.
What’s your take on the Ethereum ‘Death Cross’? Share your thoughts and ideas with us using the comments section at the end of the article or you can contact me on Twitter @nickcawley1 or via email at nicholas.cawley@ig.com.
--- Written by Nick Cawley, Analyst.


