Ripple (XRP) News and Talking Points
- Ripple’s bounce of its $0.45 weekend low lacks conviction.
- XRP needs some fundamental good news if it is to break higher.
Ripple (XRP) Chart Still Controlled by the Bears
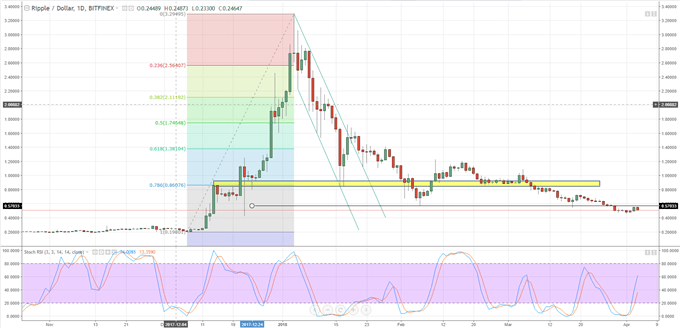
Ripple’s brief rally from its weekend low at $0.45 looks over in the short-term with the coin struggling to push higher in a weak cryptocurrency market. The overall crypto market capitalization currently stands at $267 billion, sharply lower from the $830 billion high seen on January 7 this year.
Looking at the charts, Ripple made two brief attempts and failed to break the $0.57 resistance level, made from the February 6 low, and now looks likely to make another attempt at the December 22 ‘spike’ low at $0.42. If this level is broken convincingly the next level of support remains around $0.20, the start of the December 7 – January 4 rally. On the upside, $0.57 is followed by resistance at $0.72 and the bottom of the yellow trading range at $0.84.
With little in the way of good news in the market, and with all relief rallies being sold into, Ripple is likely to push lower again. The stochastic indicator is nearing overbought territory while the IG client sentiment indicator – see above - shows traders are overwhelmingly long XRP, a worrying set-up in a market that continues to fall sharply.
We will be discussing a range of cryptocurrency charts and price set-ups at our Weekly Cryptocurrency Webinar today (Wednesday) at 12:00.
Ripple (XRP) Price Chart in US Dollars(October 26, 2017 – April 4, 2018)

Cryptocurrency Trader Resources – Free Practice Trading Accounts, Guides, Sentiment Indicators and Webinars
If you are interested in trading Bitcoin, Bitcoin Cash or Ethereum check out our Introduction to Bitcoin Trading Guide.
What’s your opinion on Ripple – bullish or bearish? Share your thoughts and ideas with us using the comments section at the end of the article or you can contact me on Twitter @nickcawley1 or via email at nicholas.cawley@ig.com.
--- Written by Nick Cawley, Analyst.


