


Bitcoin (BTC), Ripple (XRP), Litecoin (LTC) News and Analysis
- Twitter follows Facebook and Google and bans cryptocurrency ads.
- Litecoin pulls LitePay, apologizes for ‘hyping up this company’.
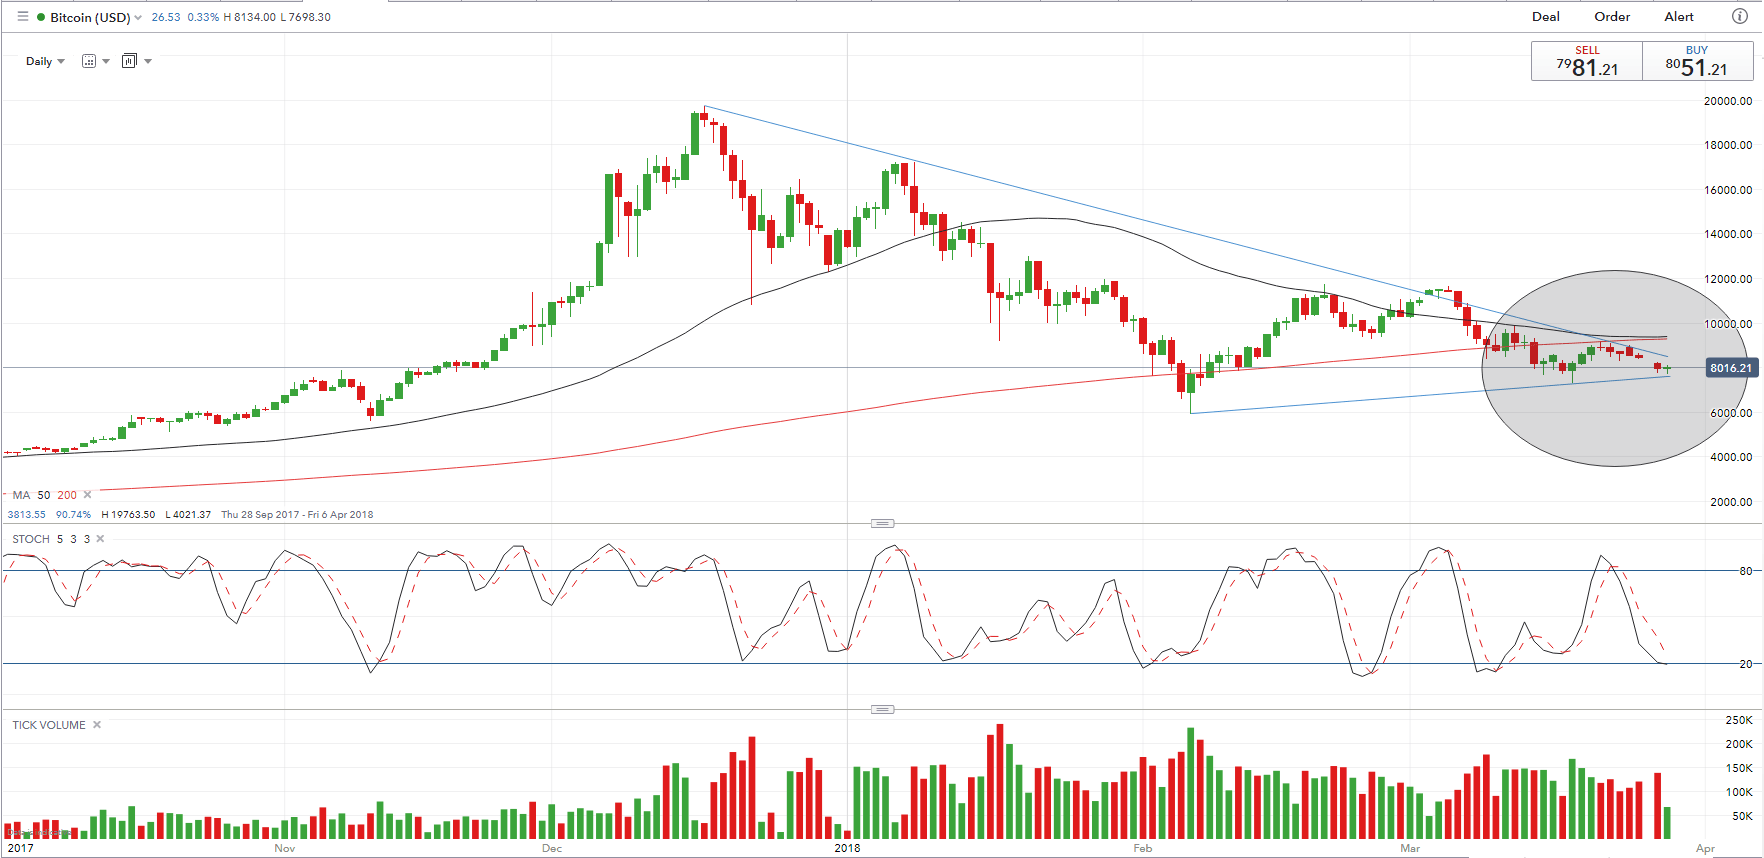
- Bitcoin chart highlights worrying technical signals.
We have recently released A Guide to Day Trading Bitcoin & Other Cryptocurrencies to help traders navigate this volatile marketplace.
Cryptocurrency Market Remains Negative
Online news and networking giant Twitter became the latest company to pull cryptocurrency advertising, following in the steps of Facebook and Google, in an attempt to restrain potentially fraudulent behavior on its platform. The ban sent the cryptocurrency market lower and was followed by news that the Litecoin Foundation had ditched the launch of payment processor company LitePay, prompting a mea culpa from Litecoin founder Charlie Lee, who tweeted his regret for having “hyped up this company and (we) vow to do better due diligence in the future”. Litecoin continued its recent bearish movement and slipped through Fibonacci support at $524. The coin currently trades around $457.
Bitcoin continues to lose market capitulation, dropping $20 billion over the week to currently stand at £135 billion, while the price chart shows a descending wedge formation nearly completing, a technically bearish signal. In addition the 50-day moving average is likely to trade below the 200-day moving average, another negative technical signal.
Bitcoin Price Chart in US Dollars (October 1, 2017 – March 28, 2018)
Cryptocurrency Trader Resources
If you are interested in trading Bitcoin, Bitcoin Cash or Ethereum check out our Introduction to Bitcoin Trading Guide.
What’s your opinion on the cryptocurrency market at the moment? Share your thoughts with us using the comments section at the end of the article or you can contact the author via email at Nicholas.cawley@ig.com or via Twitter @nickcawley1.
--- Written by Nick Cawley, Analyst.


