Talking Points:
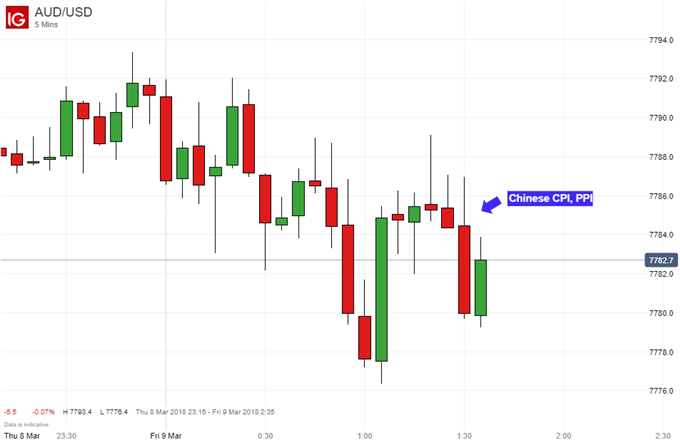
- The Australian Dollar declined on better-than-expected Chinese inflation data
- China CPI at 2.9% y/y versus 2.5% expected, the highest since November 2013
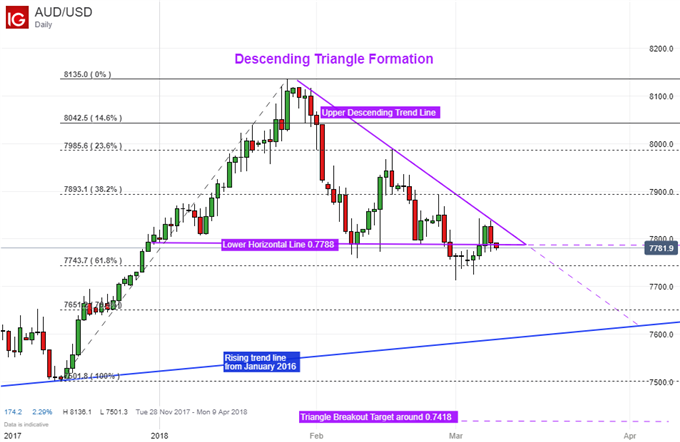
- AUD/USD is wedged in between critical levels after a bearish reversal pattern
Just started trading AUD/USD and not sure how to apply the bearish reversal pattern into your strategy? Check out our beginners’ FX markets guide !
The Australian Dollar took a small hit as February’s Chinese inflation figures beat expectations. CPI was 2.9% y/y versus 2.5% expected, the highest since November 2013. However, producer prices only rose 3.7% y/y versus 3.8% expected.
Higher inflation in China could translate into tighter lending conditions, slowing economic growth. This could in turn have negative consequences for Australia’s economy due to China being their largest trading partner. This may have been why the Aussie Dollar didn’t take the news too kindly, however there appears to be more prominent risks on the horizon.
Late into Thursday’s session, US President Donald Trump signed his proposed tariffs on steel and aluminum. Notably, Canada and Mexico were exempted from the provisions and there is potential for more countries to be excluded. With that in mind, if Australia ends up as one of them, this could bode well for the Australian unit.

AUD/USD Technical Analysis: Stuck In Between Stubborn Support and Resistance
On a daily chart, AUD/USD appears to be struggling to make further progress to the downside after the formation of a bearish reversal pattern. Near-term support seems to be a combination of the “lower horizontal line” of a descending triangle and the 61.8% Fibonacci retracement level at 0.7743.
At the same time, it remains contempt within a descending resistance line that has prevented it from rising either. With that in mind, a push to the upside exposes the 38.2% level at 0.78931.

AUD/USD Trading Resources:
- Having trouble with your strategy? Here’s the #1 mistake that traders make
- See how the Australian Dollar is viewed by the trading community at the DailyFX Sentiment Page


