


Gold Talking Points
- Higher US interest rate expectations continue to weigh on the precious metal.
- Chart support at $1,301/oz. may be tested in the short-term.
If you are interested in trading gold, we have a wide range of technical and fundamental trading and educational guides that can help you along your journey. We have also produced a revealing Traits of Successful Traders guide that will show you how to constantly improve and update your trading skills.
Gold Continues its Move Lower due to US Dollar Bullying
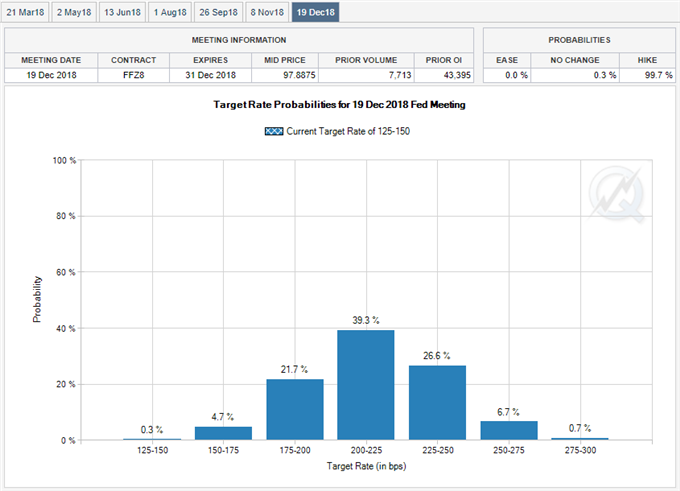
Gold continues to fall, and is eyeing technical support just above $1,300/oz. as the US dollar continues to gain following hawkish commentary from the new Fed chair Jerome Powell on Tuesday. The greenback is being boosted as market expectations of up to four US rate hikes gather momentum. A look at the implied US rates for the December 18 FOMC meeting show a 26.6% probability of a fourth rate hike, up from 19.6% one month ago. While a fourth hike is still unlikely, Fed chair Powell’s speech has bought it back to the table and traders are watching bond yields closely for any further signs that monetary policy will be tightened further.
US Fed Fund Rate Probabilities for December 19, 2018 Meeting.
Gold Price Weakness Heads Nears Momentum Support
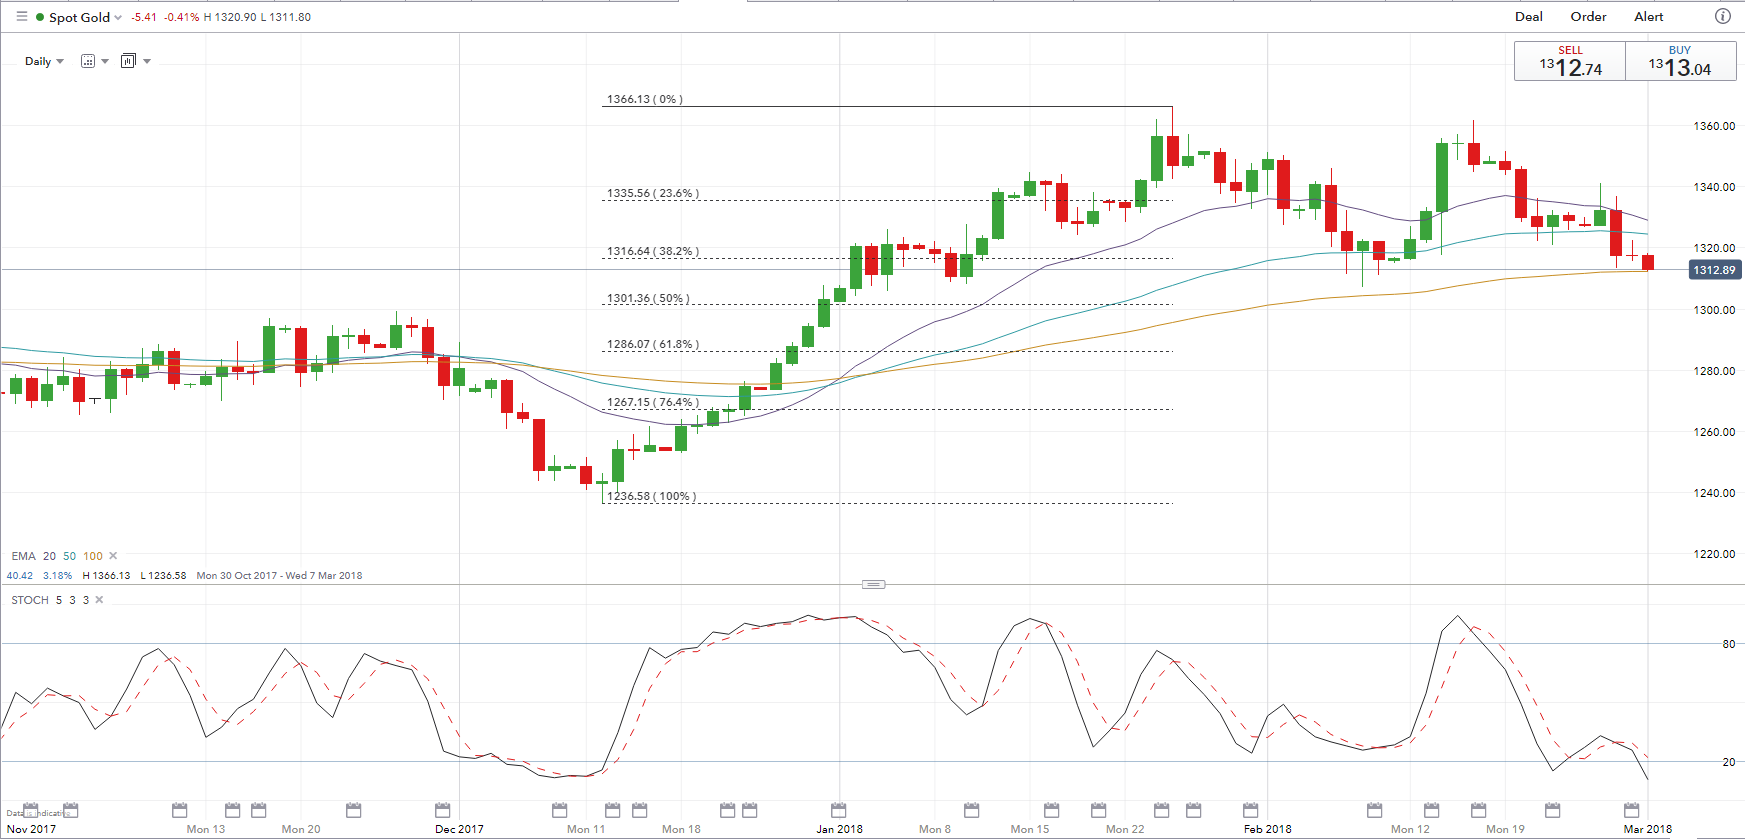
The latest gold chart highlights the recent price fall through Fibonacci support at $1,316/oz. leaving the 50% retracement level at $1,301/oz. as the next target for the bears. The latest plunge has also taken the price below 20- and 50-day EMA support and it currently sits on the important 100-day EMA line at $1,311/oz. A break and close below this level would bring the $1,301/oz. target firmly into play. A modicum of relief may come from the stochastic/momentum indicator which currently sits in extreme oversold territory.
Gold Price Chart Daily Timeframe (October 30, 2017 – March 1, 2018)
Traders are Long Gold but Recent Trade Data Gives a Mixed Signal
IG Retail Trader Data show 67.1% of traders are net-long with the ratio of traders long to short at 2.04 to 1. The number of traders net-long is 1.7% lower than yesterday and 12.9% higher from last week, while the number of traders net-short is 18.9% higher than yesterday and 2.7% higher from last week.
We typically take a contrarian view to crowd sentiment, and the fact traders are net-long suggests Spot Gold prices may continue to fall. Positioning is less net-long than yesterday but more net-long from last week. The combination of current sentiment and recent changes gives us a further mixed Spot Gold trading bias.
--- Written by Nick Cawley, Analyst
To contact Nick, email him at nicholas.cawley@ig.com
Follow Nick on Twitter @nickcawley1


