
Talking Points:
- Fourth quarter 2017 Australia Capex contracted 0.2%, first negative since Q4 2016
- The Australian Dollar depreciated against its major peers as the data was released
- AUD/USD fell below a bearish continuation pattern on the daily, obstacles ahead
Trade all the major global economic data live and interactive at the DailyFX Webinars. We’d love to have you along.
The Australian Dollar depreciated against its major counterparts after a local Capex report crossed the wires. Private capital expenditures in Australia declined 0.2% in the fourth quarter of 2017. Not only was this the first contraction since Q4 2016, but it was also the largest one since then. Economists were calling for investment to increase by 1.0%. In addition, the Q3 2017 1.0% gain was revised higher to 1.9%.
Reductions in capital expenditure by firms can be seen as a negative for the economy. This is because businesses may end up spending less to upgrade their facilities and equipment which could in turn soften the pace of inflation.
Still, the Reserve Bank of Australia expects underlying core price growth of 2 percent by the end of 2019. They have also hinted that they are in no rush to raise rates as is. It seems unlikely that the central bank could change course on a single piece of softer Capex data. With that in mind, we will see what they have to say about overall prices at their next monetary policy announcement on March 6th.

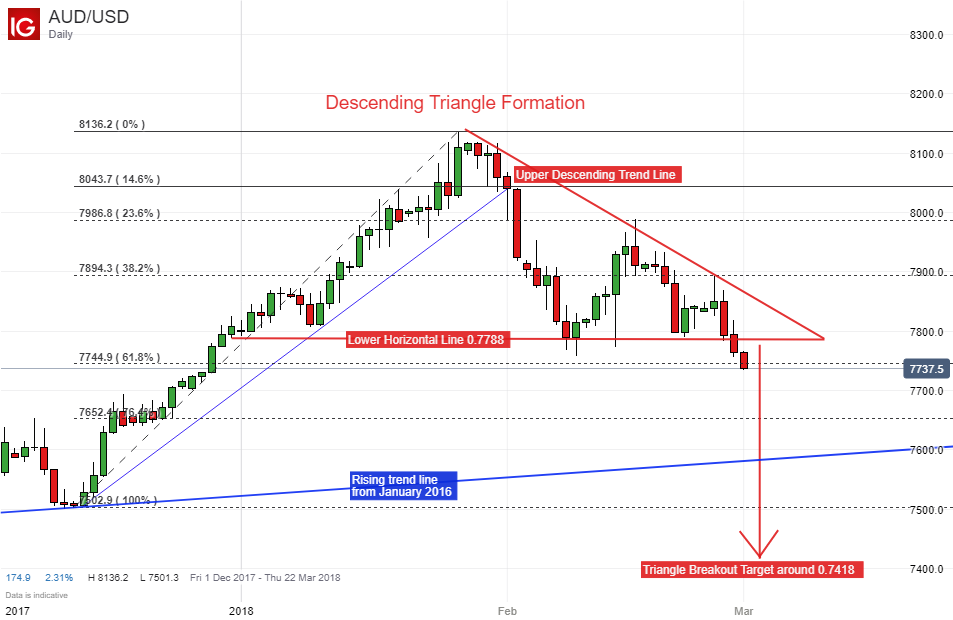
On a daily chart, AUD/USD has broken below horizontal support of a recently formed descending triangle pattern. By taking the widest distance of the pattern and subtracting it from the horizontal line, we arrive at a price target of this formation around 0.7418.
However, getting there involves conquering a few obstacles. Namely, the 61.8% and 76.4% Fibonacci retracement levels at 0.7744 and 0.7652 respectfully. While they may stand in the way as immediate support, the rising trend line from January 2016 could be the more stubborn area to push through.
Should AUD/USD turn around and start climbing, the two lines that make up the descending triangle seem like they could end up as immediate resistance. A push above those will expose the 38.2% Fibonacci retracement at 0.7894.