Litecoin Price (LTC) News and Talking Points
- LitePay launch cancelled due to ‘recent hostile actions by card issuers’.
- Litecoin chart highlights a sharp move ahead.
Litecoin (LTC) Price Hit by LitePay Postponement
The highly anticipated LitePay credit card launch was postponed early this week, according to a company email, stalling the recent sharp rise in the fifth-largest digital token. The announcement early this month of the credit card had helped to boost the price of LTC in excess of 60% as buyers took control of the market. According to media reports, the customer email stated that “Due to recent hostile actions by card issuers towards crypto companies, we have decided that offering LitePay card registrations at this time is imprudent.” The email added that the company will continue to monitor the situation with regards to card services and will open registration “as soon as a reliable product can be supported.”On the vendor/merchant side, the launch of LitePay Merchant went ahead as scheduled.
Litecoin Chart Nears Point of Conflict
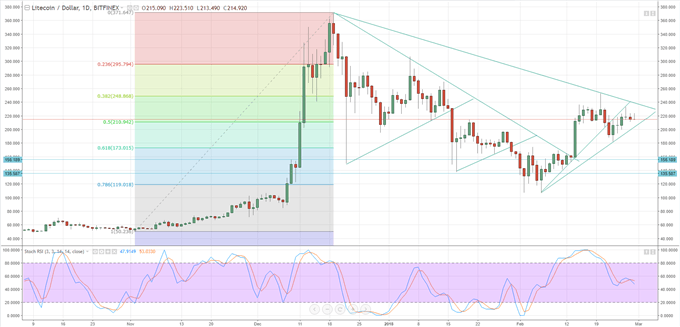
The latest LTC chart shows the price heading back to the 50% Fibonacci retracement level at $210 with the recent uptrend line just below at $203. A break and close below could open the way to the February 23 low at $181 and the 61.8% retracement level at $173, which should provide decent support for the digital coin. A break above the recent downtrend line, currently around $237, would open the way to $248, before the February 20 high of $253 comes into play. Either way, with the downtrend and uptrend lines joining soon and with important Fibonacci technical levels in play, a sharp move either way cannot be discounted.
If you would like further information on how to use Fibonacci as a Leading Indicator, go to the ‘Advance Level’ section in our DailyFX Education Centre and download our free trading guides.
We will be discussing Litecoin in further detail today at 12:00pm in our Weekly Cryptocurrency Webinar.
Litecoin Price Chart Daily Time Frame (October 10, 2017 – February 19, 2018)

Cryptocurrency Trader Resources – Free Practice Trading Accounts, Guides, Sentiment Indicators and Webinars
If you are interested in trading Bitcoin, Bitcoin Cash or Ethereum we can offer you a wide range of free resources to help you. We have an Introduction to Bitcoin Trading Guide. In addition we run a Weekly Bitcoin Webinar and have an IG Bitcoin Sentiment Indicator to help you gauge the market and make more informed trading decisions.
What’s your opinion on Litecoin and the latest hard fork? Share your thoughts with us using the comments section at the end of the article or you can contact the author via email at Nicholas.cawley@ig.com or via Twitter @nickcawley1.
--- Written by Nick Cawley, Analyst.


