ZAR talking points:
- The South African Rand reached its highest level against the US Dollar for nearly three years Thursday.
- That follows a surprise decision by President Jacob Zuma to resign ahead of a planned Parliamentary vote of no confidence in him.
Learn how to trade like an expert by reading our guide to the Traits of Successful Traders
New to forex and want to find out more about trading? Take a look at our Forex Trading Guides
Rand strengthens
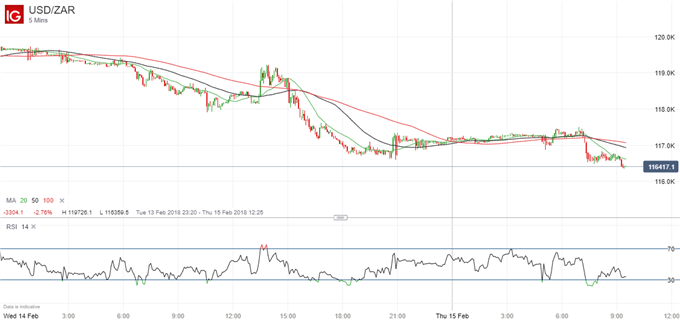
The South African Rand extended its gains Thursday after a decision by Jacob Zuma to resign as the country’s President. In a Parliamentary vote due today, his deputy, Cyril Ramaphosa, will likely be confirmed as his successor.
The Rand has tended to strength whenever Zuma, who has been accused of corruption but consistently denied the allegations, has suffered a setback. His resignation has paved the way for a further advance in the currency, sending USDZAR to its lowest point since March 2015.
USDZAR Price Chart, Five-Minute Timeframe (February 14/15, 2018)

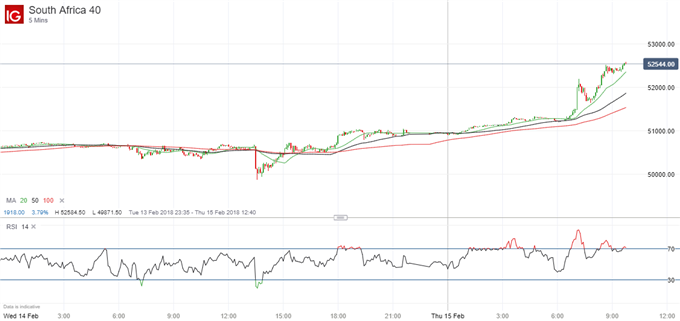
South African bonds and stocks also benefited from Zuma’s decision to resign ahead of a planned Parliamentary vote of no confidence in him that he would almost certainly have lost. The yield on the South African 10-year government bond fell by11 basis points to 8.285% as demand rose for the bonds.
In the Johannesburg stock market, the FTSE/JSE top 40 index was up by more than 4% to 52,550.
FTSE/JSE Top 40 Price Chart, Five-Minute Timeframe (February 14/15, 2018)

--- Written by Martin Essex, Analyst and Editor
Feel free to contact me via the comments section below, via email at martin.essex@ig.com or on Twitter @MartinSEssex
For help to trade profitably, check out the IG Client Sentiment data
And you can learn more by listening to our regular Trading Webinars


