Oil Talking Points
- Brent Crude oil price nears a six-week low on larger-than-expected US Crude oil stockpiles.
- Technical support zone nears although supply fears and USD strength may test robustness.
Oil Sell-Off Nears Chart Support Levels
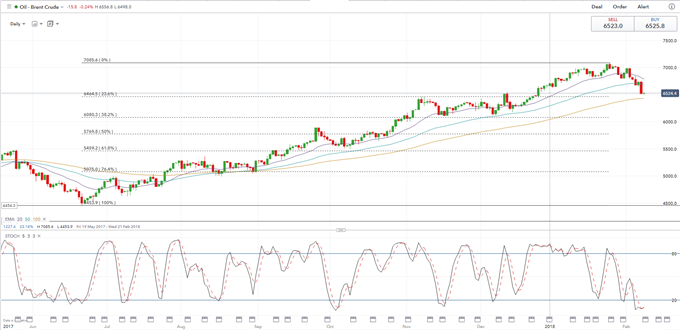
The latest US government oil report showed crude oil stockpiles rising unexpectedly by 1.9 million barrels against forecasts of 1.1 million barrel drop, sending the oil market tumbling lower. Brent crude tumbled through the 50-day EMA technical support for the first time since late August 2017, hitting a six-week low.
The oil complex as a whole has also been under pressure lately as the US dollar continues to make a comeback from its recent low, with a stronger US dollar making oil more expensive for non-US dollar buyers. The US dollar has been gaining strength since the end of last week when better-than-expected US jobs and wages data stoked expectations of higher inflation, sending US Treasury yields higher.
The latest oil market downturn has pushed Brent Crude close to a couple of important technical support levels, while one momentum indicator is flashing a heavily oversold signal. The chart below shows Brent nearing the 23.6% Fibonacci retracement level of the June 2017 – January 2018 rally at $64.645/bbl., a level in close proximity to the current 100-day EMA support at $64.30/bbl. In addition the stochastic indicator, a closely watched momentum gauge, is trading in heavily oversold territory, suggesting a turnaround in the price of oil may be close.
A break and close below these support levels however would leave the market open to a move down to the cluster of November/December lows around $61.05/bbl. and Fibonacci support at $60.80/bbl.
Brent Crude Oil Price Chart in US Dollars (May 2017 – February 8, 2018)

We have a wide range of Trading Forecasts and Guides available to help traders make more informed decisions.
--- Written by Nick Cawley, Analyst.
To contact Nick, email him at nicholas.cawley@ig.com
Follow Nick on Twitter @nickcawley1


