


Talking Points:
- The Consumer Price Index (CPI) came in at 2.1%, in line with estimates; core inflation also beat the estimates 1.7% coming at 1.8%
- Advance retail sales see slight up tick in December
- 10-year US Treasury yield rises to 2.58% following CPI
- See the DailyFX Economic Calendar for upcoming economic data and for a schedule of live coverage see the DailyFX Webinar Calendar.
Consumer Price Index
According to the U.S. Bureau of Labor Statistics (BLS), The Consumer Price Index (CPI) for all itemsrose 2.1% (YoY) over the last 12 months, before seasonal adjustment.This comes after a 2.2% increase in November. The BLS also stated that the 0.4%increase in the shelter index accounted for merely 80% of the 1-month all items increase.The index for all items less food andenergy (core) increased 1.8% (YoY)over the last year. This 12-month change has floated between 1.7%and 1.8%for eight consecutive months.
Simarly, the food index increased in December. The energyindex, which spiked in November, declined in December as did the gasolineindex.Other indices which saw a decline in December included apparel, airline fares, and tobacco. See the BLS’ percent changes CPI table below:
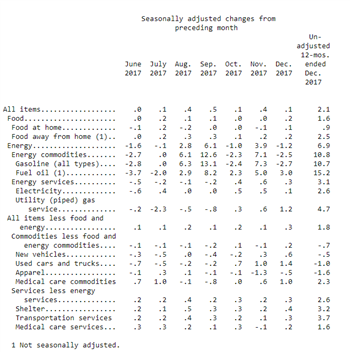
Source: Consumer Price Index Summary
The Consumer Price Index CPI measures the change in prices paid by consumers for goods and services. The CPI reflects spending patterns for all urban consumers and urban wage earners, and clerical
Considering all urban consumer group represents about 89% of the total U.S. population they are a good proxy for US consumer prices. CPI is largely views as an ideal gauge for inflation.
Retail and Earnings
Reported by the Census Bureau, advance estimates of U.S. retail and food services sales for December 2017, adjusted for seasonal variationand holiday and trading-day differences, were $495.4 billion, an increase of 0.4%. This was a slight miss from the 0.5% expected print. Although th previous figure of 0.8% did see a slightly upward revision at 0.9%
Average weekly earnings rose by 0.7% following a 0.8% increase in November. Average hourly earnings also increased but by only 0.4%. This comes after a 0.2% increase in the previous month.
10-Year Yield
In the past week we have seen the U.S. 10-year Treasury yield spike to levels not reached since March 2017. The rally in the 10-year was partly because of numerous reports that China, the largest foreign holder of US government debt, was considering either slowing or halting purchases altogether of US debt. These reports were later denied by China. In addition, the rally in the 10-year has also been the result of the markets’ building inflation expectations. Also, the Bank of Japan recently announced that they will begin to pull-back accommodative policies which have suppressed yields to historic yields.
Although, the hysteria in the bond markert might have been overdone following Wednesday’s Treasury auction which saw the best demand for 10-year bonds since June 2016. Indirect bidders were awarded 71% of the 10-year supply marking the largest share since August 2016. The bid-to-cover ratio hit 2.69%.
Chart 1: US 10-Year Treasury Yield (January 1 - 12, 2018)
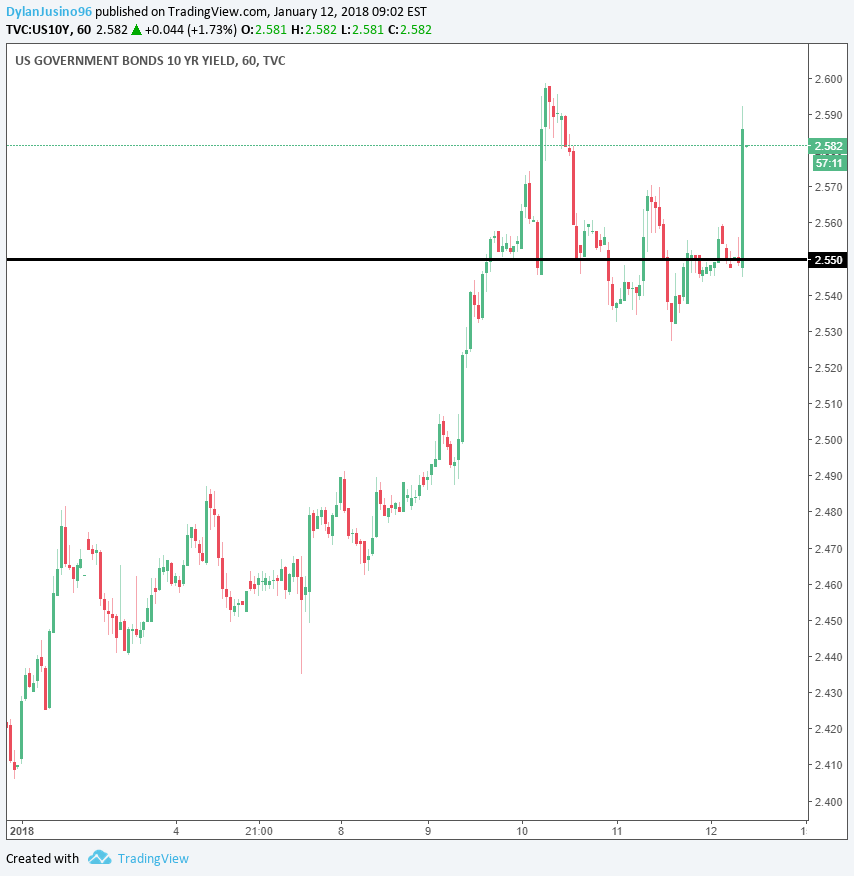
Following the release of the CPI data, the 10-year yield spiked to 2.582% matching previous highs.
Federal Reserve Rhetoric
The Federal Reserve Bank has come under increased scrutiny as it persistently misses its 2% inflation target. This week we had quite a few Fed Officials speak out on both sides of the fence when it came to inflation and rate hike expectations. Charlie Evans, president of the Chicago Fed, stated that he does not see inflation moving up faster and would not expect to hit the 2% target until the end of 2019. Evans suggested that any rate increases should be delayed until mid-2018 in lieu of low inflation and a lack of pressure in that labor market. He also dismissed the yield curve as a concern. Contrarily, Dallas Federal Reserve President, Robert Kaplan, expressed concern over falling behind the yield curve by waiting for an uptick inflation. He explained that he was seeing “economic growth everywhere” and that three interest rate hikes are still a good base case for 2018. Although, Kaplan did warn that the flattening yield curve was a sign of a sluggish growth outlook for the US economy. Finally, St. Louis Fed President, James Bullard, chimed in by acknowledging that the Fed’s inflation target has sparked some debate in the policies undertaken at the Central Bank. He said that inflation expectations “have gone up some” and expects oil prices to drive inflation. Ultimately, Bullard stated that he was against hiking rates at the expense of inverting the yield curve.
Fed fund futures are pricing in ajn 87% chance of a rate hike at the March Federal Open Market Committee meeting.
Below is a list of economic releases that has driven the US Dollar higher:
- USD Consumer Price Index (YoY) (DEC): +2.1% as expected, from +2.2%
- USD Consumer Price Index Ex Food & Energy (YoY) (DEC): +1.8% versus +1.7% expected, from +1.7% previous
- USD Advance Retail Sales (MoM) (DEC): +0.4% versus +0.5% expected, from +0.9% previous (revised up from +0.8)
- USD Real Avg Weekly Earnings (YoY) (DEC): +0.7% versus +0.8% previous
- USD Real Avg Hourly Earnings (YoY) (DEC): +0.4% versus +0.2% previous
Chart 1: US Dollar Index 15-minute Chart (Friday, January 11 - 12, 2018)

The chart above shows that the US Dollar Index had a relatively mute reaction to the CPI and retail data. At the time of that this article was written DXY traded slightly higher than the pre-data level at 91.45.
--- Written by Dylan Jusino, DailyFX Research


