


Talking Points:
- The ASX 200 remains near its highs for 2017
- It looks relaxed at the 6000 level which had previously stymied it
- But the bulls need to consolidate here before they can take the index higher
Get trading tips and join us for live coverage of all significant economic data at the DailyFX Webinars
The ASX 200 heads into a new year looking comfortable close to its highs for the old one.
Its basic moving averages are in good order too and neither they nor the Relative Strength Index suggest that a turnaround is at all imminent. This is not an index that looks dangerously overbought or oversold, even at relatively elevated levels. And yet the bulls still can’t seem to push on far from that psychologically interesting 6000 level, although the index remains just above it. It has certainly looked more comfortable close to that point since October than it has at any point for about ten years. But it just can’t make much progress.
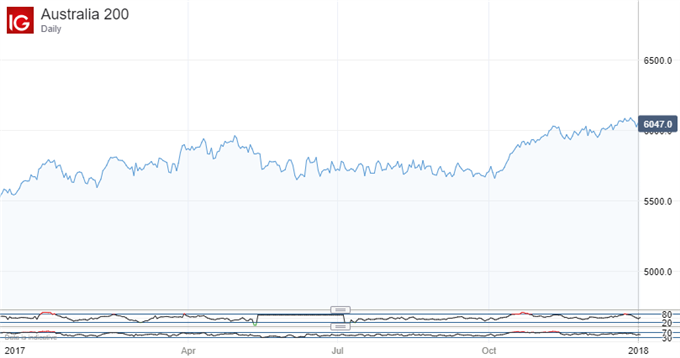
In one sense that is not surprising. 6000 has not represented as safe buying spot for the ASX for many years.
Is that likely to change in the early part of 2018? Well. Maybe. Clearly the holidays are still casting some shadow over ASX trade, much as they are over other asset classes. But something like normal service should be resumed next week. How will it find the ASX when it does?
The index clearly remains in some sort of uptrend and I have found a channel here which looks quite interesting. It is rooted in the trading action of October 27. That was an odd session for the Australian benchmark which saw an unusually wide trading range by the standards of the month in question, but very little difference between the opening and closing levels.
Friday October 27.
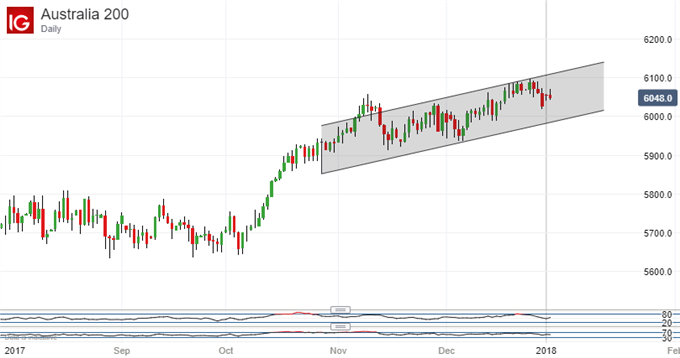
Admittedly this uptrend channel treats early November’s rise as at least partially spurious. But in so doing so it finds considerable validation elsewhere so that looks like a trade-off worth the making. Early December’s lows become convincing downside validation and the recent highs form an upside test. Obviously some caution is warranted once trading gets back to full vigour.
But this channel suggests that another test of the 6,100 level could come quite soon in 2018 and as such is probably worth watching for near-term direction. If the bulls do have any appetite to push on much higher than the 6,000 threshold then this channel’s resilience could be a handy first sign.
--- Written by David Cottle, DailyFX Research
Contact and follow David on Twitter: @DavidCottleFX


