


Talking Points:
- The ASX 200 has offered investors a scant, 160-point range since mid-May
- However the last few trading sessons have seen it confined to the lower half of the range
- Its base is under more pressure than it has been for months.
New to the trading world? Our beginners’ guide is here to help
Take a look at the ASX 200’s daily chart and at face value you’d be justified in thinking, “well, there’s nothing much to see here.”
For the index remains trapped within the tight, 160-point range which has somewhat bizarrely contained all the action on a daily-close basis since mid-May. Indeed, if you strip out the closing highs of mid-June (which at this distance I think we can) the range narrows even further.
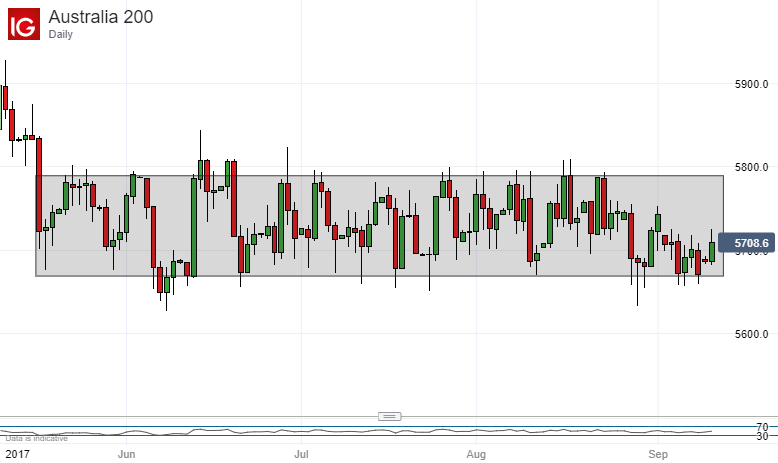
A look at the above suggests that the shaded area remains all that traders have to play with, and that they should plan their strategies accordingly. That means buying around current levels and bailing as close to 5800 as their constitutions will allow.
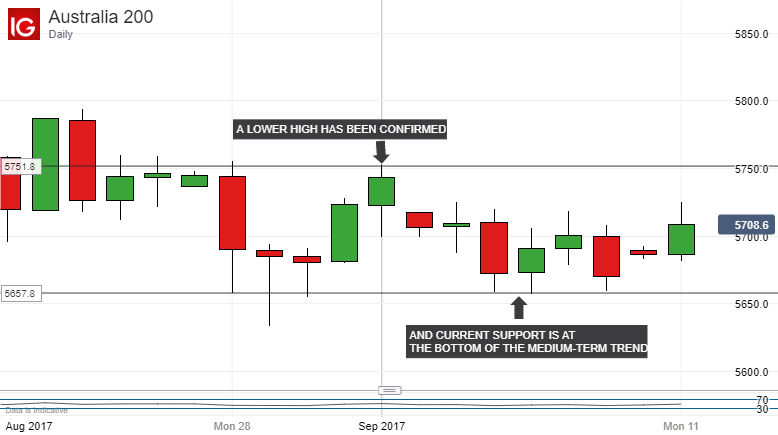
However, if we take a closer look at more recent events, then things take a more sinister turn, at least for bulls.
September 1’s lower high of 5751 had not been confirmed when I last looked at the ASX. It has been now.
Moreover, although the current revival of risk appetite has seen the index gain, it still looks to be moving into a lower “sub range” of the old band, with its top around current levels.
While momentum indicators are giving little away – with the index neither overbought of oversold to any significant degree – it looks as though a tentative “pennant” might be forming on the charts. If sothis is what’s known in technical circles as a continuation pattern which means that, once it resolves, market action will spring back to the status quo ante. That would see the index take a leg lower.
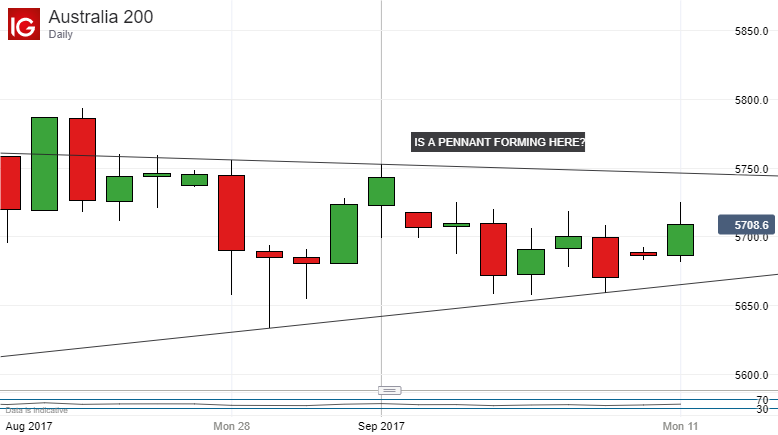
From current levels that could be very significant. Watch the current range bottom; if the pennant scenario plays out, it could be about to give at last.
--- Written by David Cottle, DailyFX Research
Contact and follow David on Twitter: @DavidCottleFX


