


US DOLLAR STRENGTH ACCELERATING USD/CAD BREAKOUT, AUD/USD PLUNGE
- US Dollar strength rippling across the board of major currency pairs this week
- DXY Index surged above the 93.50-price level and trades at year-to-date highs
- USD/CAD soared 170-pips while AUD/USD plummeted 86-pips on the session
US Dollar bulls staged a forceful move during Thursday’s trading session. The Greenback strengthened against virtually all major FX peers such as the Euro, Sterling, Aussie, and Loonie. Broad-based US Dollar gains helped the DXY Index invalidate key resistance and soar to a fresh yearly high above the 93.50-price level.
USD/CAD and AUD/USD have reflected US Dollar strength in particular recently with mounting global growth concerns weighing negatively on commodity currencies and fueling safe-haven demand. In fact, both the Canadian Dollar and Australian Dollar now trade at their weakest levels relative to the US Dollar since February 2021 and November 2020, respectively. Intensifying Fed taper talk has likely helped propel the US Dollar broadly higher as well, though uncertainty surrounding the timing and scope of tapering remains.
DXY – US DOLLAR INDEX PRICE CHART: WEEKLY TIME FRAME (APR 2019 TO AUG 2021)
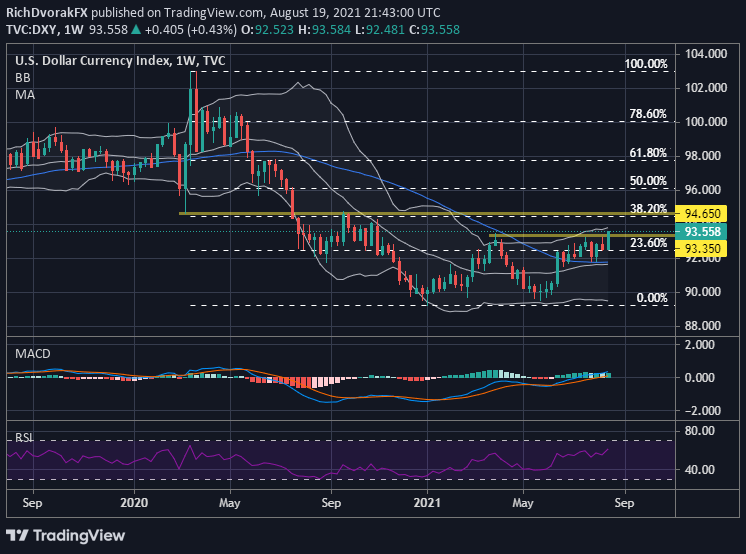
Chart by @RichDvorakFX created using TradingView
The DXY Index closing above technical resistance at the 93.35-price level this week could open up the door to further gains. As such, US Dollar bulls might have their sights set on the 94.65-price level highlighted on the weekly chart above.
This is an area of confluence underpinned by the March 2020 swing low, September 2020 swing high, and 38.2% Fibonacci retracement of the DXY Index’s pandemic trading range. Failure to maintain altitude at current levels into week-end has potential to see US Dollar bears fade recent strength and search for support around the 92.00-handle.
USD PRICE OUTLOOK – US DOLLAR IMPLIED VOLATILITY TRADING RANGES (OVERNIGHT)
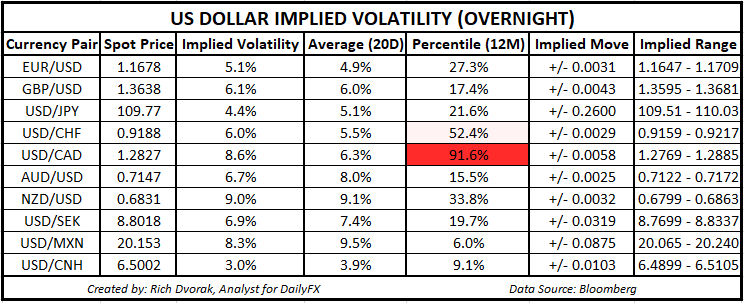
USD/CAD overnight implied volatility has crept higher owing to the latest breakout above the 1.2800-price level. More volatility for this pair is expected on Friday in light of event risk detailed on the economic calendar. Specifically, Canadian retail sales and housing price index are scheduled for release at 12:30 GMT while Dallas Fed President Robert Kaplan is slated to give a speech at 15:00 GMT. USD/CAD overnight implied volatility of 8.6% is above its 20-day average reading of 6.3% and ranks in the top 91st percentile of measurements taken over the last 12-months.

-- Written by Rich Dvorak, Analyst for DailyFX.com
Connect with @RichDvorakFX on Twitter for real-time market insight


