


US DOLLAR PRICE OUTLOOK: USD BULLS DEFENDING KEY TECHNICAL SUPPORT LEVEL
- US Dollar volatility accelerated on Monday as the Greenback staged a big intraday reversal
- DXY Index recoiled higher as US Dollar bulls keep defending a key technical support level
- USD price action might continue to fluctuate within the confines of its broader trading range
The US Dollar inked a huge intraday reversal during Monday’s trading session. USD price action declined a notable -0.4% as measured by the broad-based US Dollar Index early on, but following the release of an impressive US PMI report, the Greenback subsequently staged an eye-popping rally to finish the day up about 0.2% on balance. The influx of US Dollar strength also appears to coincide with a rebound off a critical technical support level as bulls continue to defend the 92.00-handle on the DXY Index.
DXY - US DOLLAR INDEX PRICE CHART: MONTHLY TIME FRAME (FEB 2011 TO NOV 2020)

Chart by @RichDvorakFX created using TradingView
A big-picture look at the US Dollar Index using monthly candlesticks brings to focus a longstanding bullish trendline extended through the May 2011 and May 2014 swing lows. USD selling pressure since the March 2020 swing high remains a prevalent theme, but US Dollar bulls have stood their ground and kept the Greenback largely afloat around this key technical zone.

In addition to its lower Bollinger Band, this potential area of buoyancy is also highlighted by the 38.2% Fibonacci retracement of its May 2011 to January 2017 trading range. A clean break below this support level around the 92.00-mark might open the door to more US Dollar downside - perhaps toward the 2018 swing lows. Nevertheless, it seems more likely that the US Dollar Index could continue along its turbulent drift sideways with the 50-day simple moving average near the 93.30-price standing out as a potential level of resistance.
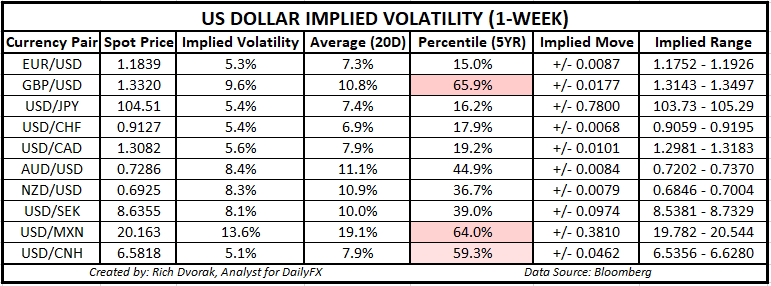
USD PRICE OUTLOOK: US DOLLAR IMPLIED VOLATILITY TRADING RANGES (1-WEEK)
Learn More - What is Implied Volatility & Why Should Traders Care?
GBP/USD is expected to be the most active major currency pair this week according to US Dollar implied volatility readings just taken. This likely follows growing prospects for UK officials to announce a long-awaited Brexit trade deal. Keeping an eye on the direction of EUR/USD and USD/JPY throughout the week could also be prudent seeing that their respective 1-week implied moves of 87-pips and 78-pips could underestimate realized volatility - particularly considering the acceleration in US Dollar volatility on Monday.
| Change in | Longs | Shorts | OI |
| Daily | -17% | 6% | -7% |
| Weekly | -22% | 17% | -8% |
-- Written by Rich Dvorak, Analyst for DailyFX.com
Connect with @RichDvorakFX on Twitter for real-time market insight


