


US DOLLAR PRICE VOLATILITY REPORT: USD WEAKENING RESUMES AMID PULLBACK IN TREASURY YIELDS
- USD price action is trading on its back foot again as Treasury yields retreat from last week’s rally
- DXY Index perched around its weakest level in two-years amid sustained US Dollar weakness
- FOMC minutes and Markit PMI data on tap for release could spur currency volatility
US Dollar weakening looks back in full force this week as the DXY Index approaches two-year lows. USD price action is on the defensive again after notching a brief relief bounce alongside surging Treasury yields. The aggressive rise in Treasury yields likely helped boost the USD, but as sovereign interest rates begin to retreat, earmarked by ten-year Treasury yield slipping back below 70-basis points, the US Dollar is coming back under pressure.
DXY INDEX – US DOLLAR PRICE CHART & TEN-YEAR TREASURY YIELD OVERLAID: 2- HOUR TIME FRAME (05 AUG TO 17 AUG 2020)

Chart created by @RichDvorakFX with TradingView
Also, it is possible that the latest stretch lower by the US Dollar corresponds with FX traders gearing up for the scheduled release of FOMC minutes due this Wednesday, August 19 at 18:00 GMT. In the wake of the last Fed meeting, it was noted how US Dollar weakness could linger considering the central bank echoed its commitment to keeping financial conditions accommodative and decision to extend USD swap lines.
USD PRICE OUTLOOK – US DOLLAR IMPLIED VOLATILITY TRADING RANGES (1-WEEK)
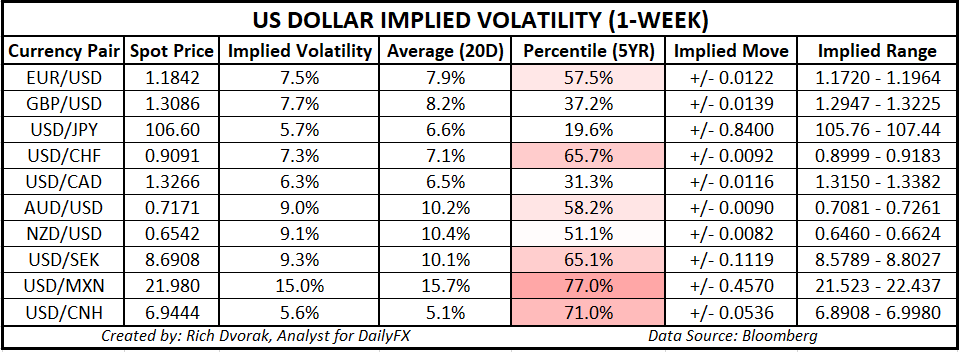
With US Dollar shorts hitting nine-year highs according to the latest COT Report, however, one could argue that this trade is getting overcrowded and that the bullish contrarian thesis is growing louder. On that note, a resurgence of currency volatility stands out as one potential catalyst that might fuel a reversal higher by the US Dollar.
Nevertheless, as EUR/USD builds a range, it is possible that the broader DXY Index continues to drift sideways. Options-implied trading ranges are calculated using 1-standard deviation (i.e. 68% statistical probability price action is contained within the implied trading range over the specified time frame).
Keep Reading – AUD Forecast: Australian Dollar Vulnerable as Complacency Builds
-- Written by Rich Dvorak, Analyst for DailyFX.com
Connect with @RichDvorakFX on Twitter for real-time market insight


