US DOLLAR PRICE OUTLOOK: DXY INDEX EXTENDS DECLINE AS SPOT USD/JPY & USD/CAD EDGE LOWER
- US Dollar weakness continues to prevail with the DXY Index hovering around twelve-week lows
- USD/JPY price action gives back recent gains as the Japanese Yen stages a recovery attempt
- USD/CAD remains under pressure but could find support near the 1.34 price level
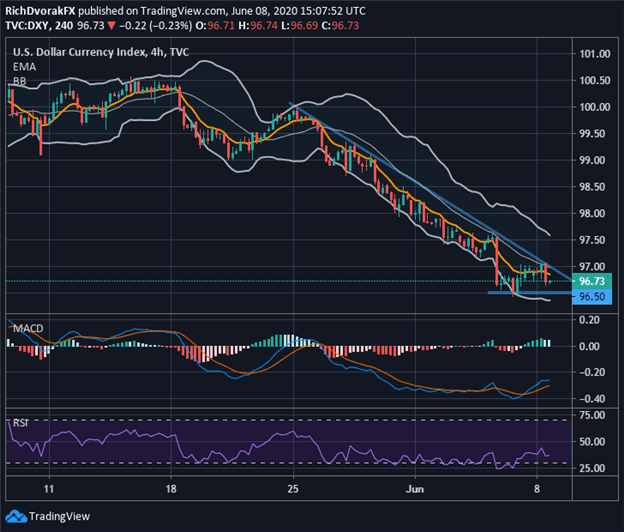
It has been a complete bloodbath for the US Dollar and market bears over the last three weeks largely due to evaporating demand for safe-haven assets. Heavy selling pressure experienced by the broader US Dollar has hammered the DXY Index to twelve-week lows with USD price action hemorrhaging as GBP/USD & AUD/USD soar, USD/CAD sinks. Sharp advances by spot EUR/USD also contributed significant technical damage to the US Dollar basket.


DXY INDEX – US DOLLAR PRICE CHART: 4-HOUR TIME FRAME (08 MAY TO 08 JUN 2020)

Chart created by @RichDvorakFX with TradingView
Though US Dollar weakness underpins the sustained wave of upbeat market sentiment, appetite for risk grows increasingly bloated. At the same time, as suggested by positive divergence on the MACD indicator, US Dollar selling has decelerated over the last few trading sessions despite the clear bearish trend.


Further, if the Bollinger Band begins to squeeze as the DXY Index attempts to build a base near the 96.50-price level, there could be potential for the broader US Dollar to claw back recent downside. That said, the 97.00-handle and the 9-period exponential moving average stand out as apparent obstacles.
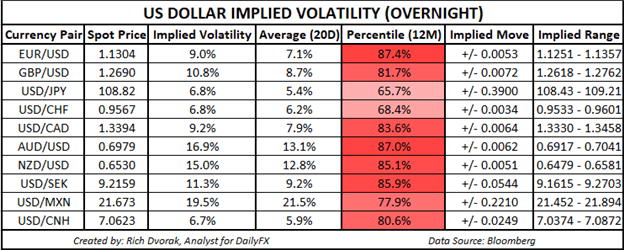
USD PRICE OUTLOOK – US DOLLAR IMPLIED VOLATILITY TRADING RANGES (OVERNIGHT)

Correspondingly, USD could perhaps maintain a rough trading range as US Dollar bears grow exhausted after the latest NFP report smashed expectations. Also, uncertainty surrounding the upcoming FOMC meeting this Wednesday, June 10 at 18:00 GMT could weigh on the direction of the US Dollar and facilitate a ‘holding pattern’ ahead of this scheduled event risk.


Options-implied trading ranges are calculated using 1-standard deviation (i.e. 68% statistical probability price action is contained within the implied trading range over the specified time frame).
Keep Reading – S&P 500 Surges as VIX ‘Fear-Gauge’ Implodes Post-Jobs Report
-- Written by Rich Dvorak, Analyst for DailyFX.com
Connect with @RichDvorakFX on Twitter for real-time market insight


