


US DOLLAR FORECAST: US DOLLAR EXTENDS SURGE AS EUR/USD PRICE ACTION PLUNGES AGAIN, USD/JPY JUMPS FURTHER & USD/MXN EXPLODES TO NEW HIGHS
- The US Dollar continues to surge with the DXY Index trading 7.5% above month-to-date lows and at its highest reading since January 2017
- USD strength has dominated the direction of major currency pairs recently as coronavirus concerns deepen despite massive stimulus efforts from the Fed
- EUR/USD price action looks to test three-year lows after taking a 7% tumble since as spot USD/JPY climbs higher and the USD/MXN breakout prints its strongest reading on record
FX traders keep bidding up the US Dollar amid far-felt risk aversion. Primarily catalyzed by the novel coronavirus outbreak (COVID-19), which has plagued global markets for most of the year, investor angst has bolstered the USD to multi-year highs.

This is largely attributed to King Dollar’s posturing as the ultimate safe-haven currency. That said, and in light of accommodative actions recently taken by the FOMC, can the surge in USD price action continue as FX volatility climbs?
DXY INDEX – US DOLLAR PRICE CHART: WEEKLY TIME FRAME (OCTOBER 2016 TO MARCH 2020)
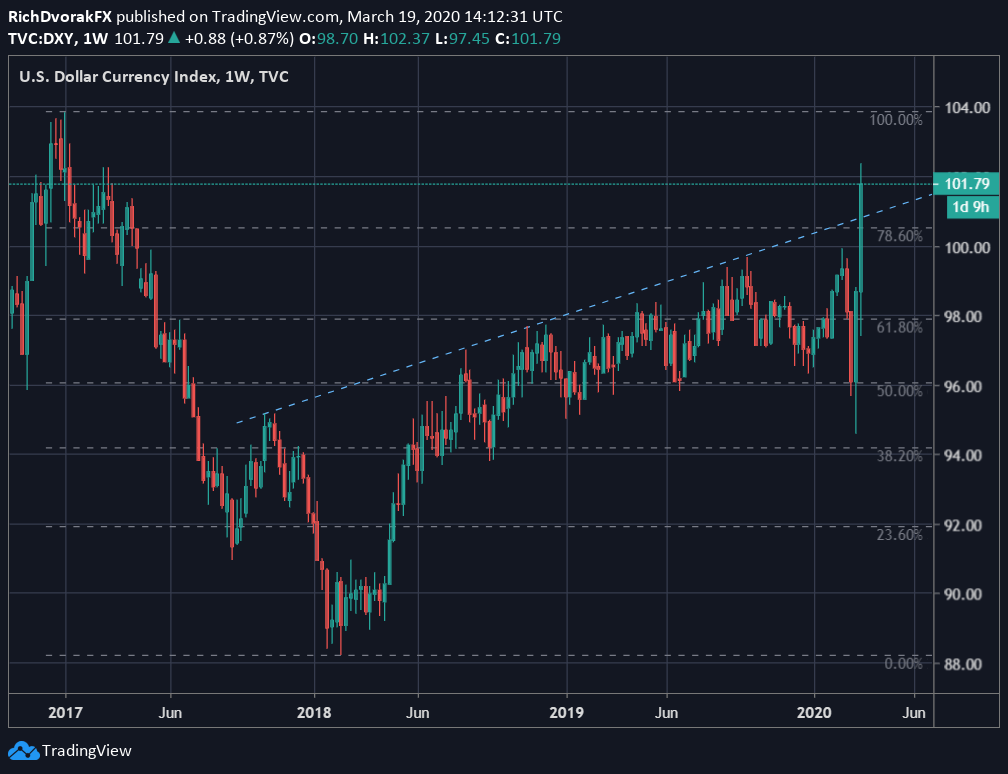
Chart created by @RichDvorakFX with TradingView
After the US Dollar Index (DXY) blew past trendline resistance and the 100.00 handle, the US Dollar benchmark might set its sights on 2017 highs next around the 104.00 level. The spike in the US Dollar over the last two weeks has been driven largely by a breakdown in EUR/USD price action. This is considering EUR/USD performance comprises 57.6% of the DXY Index.

Pessimistic sentiment surrounding the worsening coronavirus pandemic has overshadowed coordinated monetary policy stimulus efforts from global central banks. As such, USD price action could continue getting strong-armed higher with aggressively dovish Fed action washing out with ECB measures.
EUR/USD PRICE CHART: WEEKLY TIME FRAME (OCTOBER 2016 TO MARCH 2020)

Spot EUR/USD price action is trading at fresh year-to-date lows and its weakest reading in nearly three years. This follows a 750-pip breakdown in the most liquid and heavily traded currency pair over the last two weeks.
| Change in | Longs | Shorts | OI |
| Daily | -10% | 15% | -2% |
| Weekly | -3% | 25% | 5% |
EUR/USD now looks primed to probe the 1.0500 mark after spot prices breached technical support provided by the 76.4% Fibonacci retracement level of the bullish leg recorded by EUR/USD from January 2017 to February 2018. The recently developed bearish MACD crossover on a weekly EUR/USD chart also hints at potential for further weakness in spot prices as the US Dollar flexes its muscles.
USD/JPY PRICE CHART: 4-HOUR TIME FRAME (FEBRUARY 2020 TO MARCH 2020)
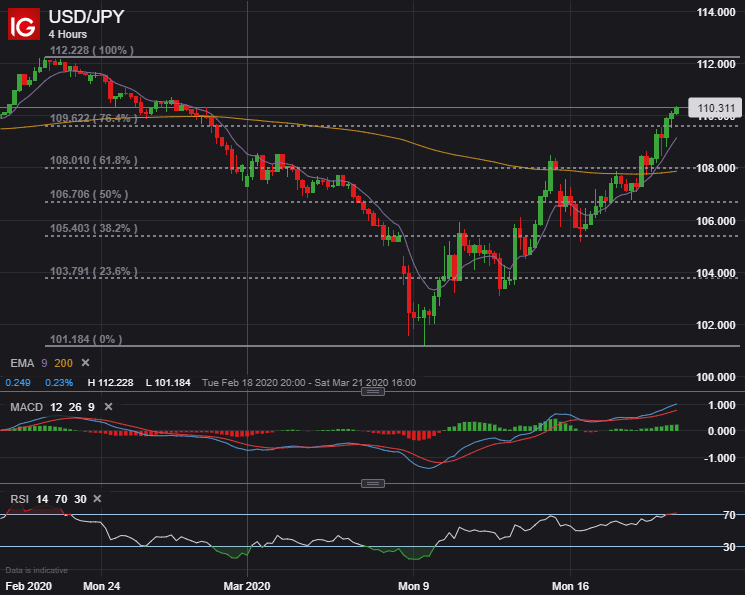
At the same time, the US Dollar has appreciated considerably against the anti-risk Japanese Yen since the FX pair, which is popularly used in the currency carry trade, bottomed out on March 09. Spot USD/JPY price action has skyrocketed 920-pips, or roughly 9%, off the 102.00 zone to eclipse the 110.00 level.
| Change in | Longs | Shorts | OI |
| Daily | 3% | -4% | -3% |
| Weekly | -1% | 0% | 0% |
Upside in the US Dollar versus the Yen over the last two weeks likely comes as currency volatility climbs while stressed liquidity dynamics boosts the USD. That said, USD/JPY could continue edgeing higher back to test year-to-date highs near the 112.00 handle.
USD/MXN PRICE CHART: 4-HOUR TIME FRAME (FEBRUARY 2020 TO MARCH 2020)
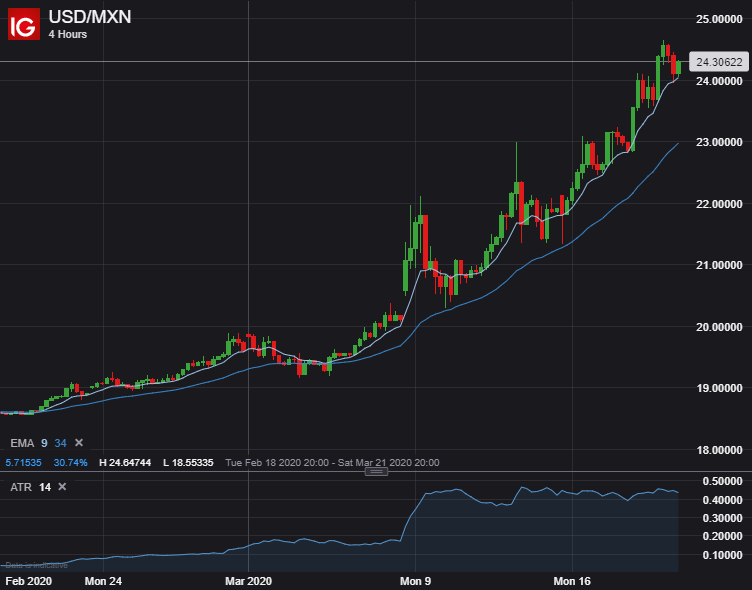
US Dollar strength stands out relative to top emerging market currencies and the Mexican Peso in particular. As the Mexican Peso collapses, which follows a crash in crude oil, USD/MXN has soared more than 30% since mid-February.

Correspondingly, with spot USD/MXN price action spiking from circa 18.500 to the 24.500 level, the US Dollar to Mexican Peso exchange rate has printed a fresh all-time high.
-- Written by Rich Dvorak, Junior Analyst for DailyFX.com
Connect with @RichDvorakFX on Twitter for real-time market insight


