


US Dollar Forecast Overview:
- The US Dollar has continued to slide during the first week of December, bringing into focus a potentially major technical breakdown.
- It still holds that the US Dollar is at a disadvantage given how far back Federal Reserve interest rate cut pricing has been pushed back: the next Fed rate cut is priced-in for July 2020.
- Retail trader positioning suggests that the US Dollar may continue to struggle over the coming days.
Looking for longer-term forecasts on the US Dollar? Check out the DailyFX Trading Guides.
Another Trip Around the US-China Trade War Cycle
Will they or won’t they? Conflicting news reports about the state of the US-china trade war Phase 1 deal have left markets in the wake of volatility. While the early part of the month has thus far produced no certainty in terms of an actual deal, the news flow has certainly harmed the US Dollar. The month of November was defined by receding Federal Reserve rate cut expectations; the tank is now empty for this catalyst.
Where does this leave us in the trade war news cycle? As we’ve previously noted, the cycle goes: (1) Trump administration is tough on China; (2) financial markets sell off on trade war concerns; (3) Trump administration hints at US-China trade deal; (4) financial markets rally on trade deal hopes; (5) No deal materializes. It appears that we’re teetering on the edge of stage 4, peering into the abyss that is stage 5.
Does this feel familiar? Exactly one year ago, concerns over the US-China trade war deal dovetailed with early-December tax loss harvesting, leading to sharp declines in asset prices ahead of the holidays. Of course, the timing of such events made possible one of the more profound Santa Claus rallies in recent memory. The next few weeks should certainly be interesting.
Read more: China Makes a Bet Against the US Dollar as World Reserve Currency
US Treasury Yield Curve Steeper…ish
The US Treasury yield curve continues to steepen, although the yield curve is twisting. Long-end yields continue to edge higher relative to where they were one-week ago, but short-end yields have fallen. This twisting US yield curve is not quite giving a raving assessment of US growth prospects; indeed, the Atlanta Fed Q4’19 GDPNow US growth forecast is a mere 1.3%.
US Treasury Yield Curve: 1-month to 30-years (December 5, 2019) (Chart 1)
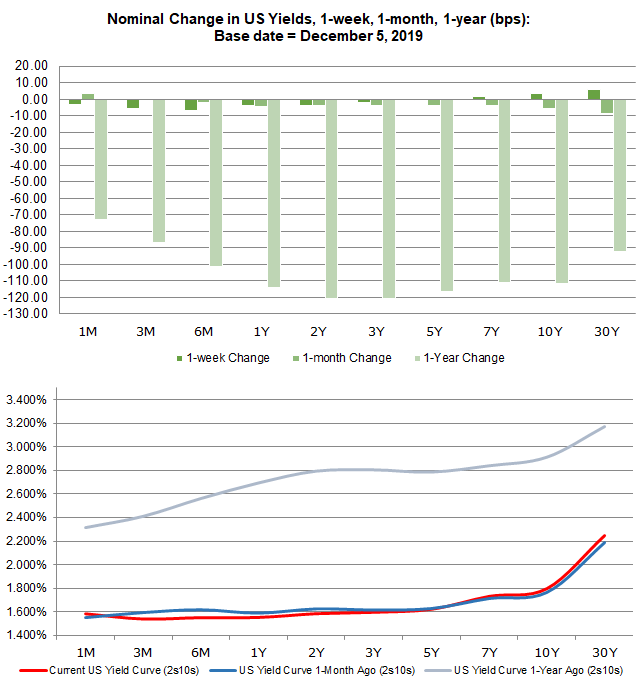
Earlier this week, it was noted that “given the fact that Federal Reserve interest rate cut expectations may have run their course (more on that below), movements in US Treasury yields may prove even more crucial to the US Dollar in the coming weeks.” This still holds as weakness in short-end yields (see: US 2-year) has undercut the greenback since Monday.
Fed Rate Cut Timing Already Depressed
According to Fed funds futures, there is now just a 4% chance of a 25-bps rate hike at the December Fed meeting (or a 96% chance of no change in interest rates); earlier this week, there was an 8% of a 25-bps rate cut and a 92% chance of no change in interest rates.
Even as Fed interest rate cut odds have remained depressed – and rate hike odds have appeared, if only minimally – the US Dollar (via the DXY Index) has continued to struggle in December, down versus every major currency month-to-date.
Federal Reserve Interest Rate Expectations (December 5, 2019) (Table 1)

According to Fed funds futures, the timing of the next interest rate cut remains depressed as it has been since early-November. For the past two weeks, rates markets have been discounting July 2020 as the most likely period for the next Fed rate cut; that remains the case today (54% implied probability).
Eurodollar Contracts See Diminished Fed Rate Cut Cycle
We can measure whether a rate cut is being priced-in using Eurodollar contracts by examining the difference in borrowing costs for commercial banks over a specific time horizon in the future. Eurodollar contracts continue to be closely aligned with Fed funds regarding the scope and scale of the Fed rate cut cycle.
The chart below showcases the difference in borrowing costs – the spreads – for the continuous front month/January 20 (orange) and the continuous front month/June 20 (blue), in order to gauge where interest rates are headed in the December 2019 Fed meeting and the June 2020 Fed meeting.
Eurodollar Contract Spreads – Continuous Front Month/January 20 (Orange), Continuous Front Month/June 20 (Blue) (June 2019 to December 2019) (Chart 2)

Based on the Eurodollar contract spreads, there is there is a 31% chance of a 25-bps rate cut by the end of the year – much more aggressive than Fed fund’s implied probability of 4%. Through June 2020, Eurodollar contracts are pricing in a 100% chance of one 25-bps rate cut and an 8% chance of two 25-bps cuts; similarly, Fed funds are pricing in a 13% chance of two 25-bps by that point in time. The divergence between Eurodollar contract spreads and Fed funds is about the timing of the next rate cut, not the magnitude or direction.
DXY PRICE INDEX TECHNICAL ANALYSIS: DAILY CHART (DECEMBER 2018 to DECEMBER 2019) (CHART 3)

In our last US dollar forecast update, it was noted that “the DXY Index [has fallen] towards the February 2018 and June 2019 rising trendline once more. Failure below this trendline would also see the DXY Index break the 61.8% retracement of the 2017 high/2018 low range at 97.87…the path of least resistance may be lower soon yet.” Such an event has occurred, and the DXY Index is now below said trendline as well the 61.8% retracement; the DXY Index was last spotted at 97.38.
Accordingly, the DXY Index’s momentum profile has shifted from bullish to bearish in rather short order. The DXY Index is below the daily 5-, 8- 13-, and 21-EMA envelope, and unlike earlier this week, the EMAs are now in bearish sequential order. Slow Stochastics have fallen into oversold territory, while daily MACD is now trending lower in bearish territory. It still holds that the path of least resistance is lower.
The better question is, “has the US Dollar’s major topping potential come back into play?” The answer may be ‘yes.’
DXY PRICE INDEX TECHNICAL ANALYSIS: WEEKLY CHART (NOVEMBER 2016 to DECEMBER 2019) (CHART 4)

If the DXY Index closes below 97.55 this week it would longer-term major topping potential in the form of a bearish rising wedge – which would ultimately call for the DXY Index to decline back towards its 2018 lows near 88.25 over the next 16-months.
EUR/USD RATE TECHNICAL ANALYSIS: DAILY CHART (DECEMBER 2018 to DECEMBER 2019) (CHART 5)

The EUR/USD rate forecast is intact as the week comes to a close. “The Euro is the largest component of the DXY Index at 57.6%, so EUR/USD is essentially a mirror image of whatever the gauge of greenback strength is moving. EUR/USD rates are experiencing a swing higher at the start of December, but they remain below resistance that has capped gains since November 5, 1.1097, which constitutes the high from the November 21 daily bearish piercing candle.” EUR/USD rates have yet to close above 1.1097.
Momentum indicators are starting to turn higher. EUR/USD rates are above their daily 5-, 8-, 13-, and 21-EMA envelope, which is aligned in bullish sequential order. Daily MACD is trending high and is now in bullish territory, while Slow Stochastics has moved into overbought territory.
It still holds that, “a move above the November 21 high at 1.1097 would also constitute a break of the descending trendline from the June and November 2019 highs, further suggesting a low has been established.”
IG Client Sentiment Index: EUR/USD RATE Forecast (December 5, 2019) (Chart 6)

EURUSD: Retail trader data shows 48.4% of traders are net-long with the ratio of traders short to long at 1.07 to 1. The number of traders net-long is 3.8% lower than yesterday and 28.1% lower from last week, while the number of traders net-short is 5.7% lower than yesterday and 21.8% higher from last week.
We typically take a contrarian view to crowd sentiment, and the fact traders are net-short suggests EURUSD prices may continue to rise. Positioning is less net-short than yesterday but more net-short from last week. The combination of current sentiment and recent changes gives us a further mixed EURUSD trading bias.
FX TRADING RESOURCES
Whether you are a new or experienced trader, DailyFX has multiple resources available to help you: an indicator for monitoring trader sentiment; quarterly trading forecasts; analytical and educational webinars held daily; trading guides to help you improve trading performance, and even one for those who are new to FX trading.
--- Written by Christopher Vecchio, CFA, Senior Currency Strategist
To contact Christopher Vecchio, e-mail at cvecchio@dailyfx.com
Follow him on Twitter at @CVecchioFX
View our long-term forecasts with the DailyFX Trading Guides


