


US Dollar Forecast Overview:
- The US Dollar will need a new source of fuel now that Federal Reserve interest rate cut pricing has been pushed back significantly (unless rate hike expectations start to materialize, which appear unlikely). Rates markets aren’t pricing in the next Fed rate cut until June 2020.
- US Treasury yields have managed to push higher in recent weeks, although both the 2-year yield and 10-year yield have not broken above their highs from the summer. If they are able to do so, then it’s likely that the US Dollar is able to extend it’s run higher.
- Retail trader positioning suggests that the US Dollar may trade sideways in the early part of December.
Looking for longer-term forecasts on the US Dollar? Check out the DailyFX Trading Guides.
US Dollar's Rough Start to December
As December gets under way, the deployment of capital after the long US holiday weekend typically brings about higher volumes across asset classes, a welcomed relief for technical traders who have been lacking the necessary participation rates to have faith in recent price action.
It would appear that the lack of any significant progress on the US-China trade war front towards a Phase 1 deal, the news last week that US President Donald Trump was moving towards tariffs on the European Union, and that the US would be reinstating steel tariffs on Argentina and Brazil, has traders probably thinking that the global economy still has it fair share of difficulties ahead of itself before 2019 comes to a close.
To an extent, all of the ‘good news’ has been priced-in for the US Dollar: ahead of the October Fed meeting, markets were pricing in one rate cut between December 2019 and March 2020; now, those expectations have been pushed back to July 2020. If the US Dollar is going to gain ground moving forward, it’s going to need US Treasury yields to turn higher. Otherwise, the greenback may be susceptible at the start of the month.
Read more: China Makes a Bet Against the US Dollar as World Reserve Currency
US Treasury Yield Curve Steepens Ever-So-Slightly
The US Treasury yield curve continues to undergo the slightest “bearish steepening,” a situation that occurs when long-end yields rise faster than short-end yields. Historically, a bearish steepening of the US yield curve has proven to be a bellwether of improved sentiment among market participants, signaling expectations for higher growth and inflation.
US Treasury Yield Curve: 1-month to 30-years (December 2, 2019) (Chart 1)
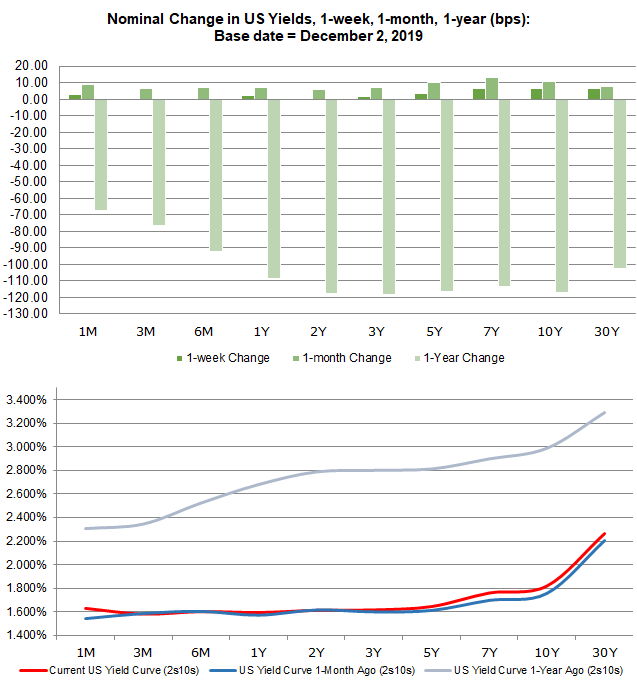
As the US Treasury yield curve has continue to steepen during November (the 3m10s spread moved from 18-bps on October 31 to 22-bps on November 29), the DXY Index gained 0.97%. At its peak, the US 3m10s spread was 42-bps on November 8.
Given the fact that Federal Reserve interest rate cut expectations may have run their course (more on that below), movements in US Treasury yields may prove even more crucial to the US Dollar in the coming weeks.
Read more: US Recession Watch, November 2019 - Recession Odds Shrink on US-China Trade War Talks
Fed Rate Cut Timing Pushed Back Further
According to Fed funds futures, there is now an 8% chance of a 25-bps rate cut at the December Fed meeting (or a 92% chance of no change in interest rates). Throughout November, particularly since the October Fed meeting, Fed interest rate cut odds have been on a steady downtrend.
With few tangible developments on the US-China trade war front, there’s little reason for traders to think that Fed Chair Jerome Powell’s comments about closing off the path to any further rate moves (after the “mid-cycle adjustment”) are invalid.
Federal Reserve Interest Rate Expectations (December 2, 2019) (Table 1)

According to Fed funds futures, the timing of the next interest rate cut remains depressed as it has been since early-November. One week ago on November 25, there was an 96% chance of no change in rates at the December Fed meeting; one-month ago, there was an 84% chance. Last week, the next rate cut was priced-in for July 2020; now, markets still favor July 2020.
Eurodollar Contracts See Diminished Fed Rate Cut Cycle
We can measure whether a rate cut is being priced-in using Eurodollar contracts by examining the difference in borrowing costs for commercial banks over a specific time horizon in the future. Eurodollar contracts continue to be closely aligned with Fed funds regarding the scope and scale of the Fed rate cut cycle.
The chart below showcases the difference in borrowing costs – the spreads – for the continuous front month/January 20 (orange) and the continuous front month/June 20 (blue), in order to gauge where interest rates are headed in the December 2019 Fed meeting and the June 2020 Fed meeting.
Eurodollar Contract Spreads – Continuous Front Month/January 20 (Orange), Continuous Front Month/June 20 (Blue) (June 2019 to December 2019) (Chart 2)

Based on the Eurodollar contract spreads, there is there is a 28% chance of a 25-bps rate cut by the end of the year – still more aggressive than Fed fund’s implied probability of 8%. Through June 2020, Eurodollar contracts are pricing in a 100% chance of one 25-bps rate cut and an 8% chance of two 25-bps cuts; similarly, Fed funds are pricing in a 12% chance of two 25-bps by that point in time. The divergence between Eurodollar contract spreads and Fed funds is about the timing of the next rate cut, not the magnitude or direction.
DXY PRICE INDEX TECHNICAL ANALYSIS: DAILY CHART (DECEMBER 2018 to DECEMBER 2019) (CHART 3)

The DXY Index climbed through the rising trendline from the February 2018 and June 2019 lows at the start of November and didn’t look back. However, the start of December has posed new problems, with a bout of weakness seeing the DXY Index immediately fall towards the February 2018 and June 2019 rising trendline once more. Failure below this trendline would also see the DXY Index break the 61.8% retracement of the 2017 high/2018 low range at 97.87.
Accordingly, the DXY Index’s momentum profile is quickly shifting from bullish to bearish. The DXY Index is below the daily 5-, 8- 13-, and 21-EMA envelope (although the EMAs are not in bearish sequential order yet). Slow Stochastics have fallen out of overbought territory and are approaching neutral, while daily MACD has issued a sell signal (albeit in bullish territory). The path of least resistance may be lower soon yet.
EUR/USD RATE TECHNICAL ANALYSIS: DAILY CHART (DECEMBER 2018 to DECEMBER 2019) (CHART 4)

The Euro is the largest component of the DXY Index at 57.6%, so EUR/USD is essentially a mirror image of whatever the gauge of greenback strength is moving. EUR/USD rates are experiencing a swing higher at the start of December, but they remain below resistance that has capped gains since November 5, 1.1097, which constitutes the high from the November 21 daily bearish piercing candle.
Amid the lack of directional trade in November, momentum indicators are mixed and/or flat. EUR/USD rates are above their daily 5-, 8-, 13-, and 21-EMA envelope, but the moving averages are not aligned in bullish sequential order. Daily MACD is trending high but is still in bearish territory, while Slow Stochastics is moving back through its median line.
A move above the November 21 high at 1.1097 would also constitute a break of the descending trendline from the June and November 2019 highs, further suggesting a low has been established.
IG Client Sentiment Index: EUR/USD RATE Forecast (December 2, 2019) (Chart 5)

EUR/USD: Retail trader data shows 60.24% of traders are net-long with the ratio of traders long to short at 1.51 to 1. The number of traders net-long is 0.43% higher than yesterday and 29.21% higher from last week, while the number of traders net-short is 5.42% higher than yesterday and 16.11% lower from last week.
We typically take a contrarian view to crowd sentiment, and the fact traders are net-long suggests EUR/USD prices may continue to fall. Positioning is less net-long than yesterday but more net-long from last week. The combination of current sentiment and recent changes gives us a further mixed EUR/USD trading bias.
Read more: China Makes a Bet Against the US Dollar as World Reserve Currency
FX TRADING RESOURCES
Whether you are a new or experienced trader, DailyFX has multiple resources available to help you: an indicator for monitoring trader sentiment; quarterly trading forecasts; analytical and educational webinars held daily; trading guides to help you improve trading performance, and even one for those who are new to FX trading.
--- Written by Christopher Vecchio, CFA, Senior Currency Strategist
To contact Christopher Vecchio, e-mail at cvecchio@dailyfx.com
Follow him on Twitter at @CVecchioFX
View our long-term forecasts with the DailyFX Trading Guides


