


US DOLLAR PRICE OUTLOOK EYES CONSUMER SENTIMENT DATA & US-CHINA TRADE HEADLINES:
- The US Dollar has churned higher for four straight days as the greenback extends its rebound amid falling FOMC rate cut expectations
- USD/JPY, USD/CAD and AUD/USD price action comes into focus for Friday’s trading session with US consumer sentiment data, a Canadian jobs report and US-China trade headlines expected
- Enhance your market knowledge with our free Forecasts & Trading Guides available for download
The US Dollar advanced steadily throughout trading Thursday driven predominantly by ebbing FOMC rate cut expectations and counterpart weakness. Another drop in Fed rate cut odds was largely fueled by additional evidence that the US labor market remains on solid footing according to jobless claims data as well as improving US-China trade relations. Meanwhile, spot EUR/USD price action swooned in response to Eurozone economic growth forecasts getting cut yet again.
On balance, the latest fundamental developments helped push the DXY US Dollar Index comfortably above the 98.00 handle to its highest reading since October 16. Though upward momentum recently exhibited by the US Dollar could soon run out of steam as the broad DXY Index approaches an intimidating level of technical resistance. A nearside obstacle for US Dollar bulls to overcome is highlighted by the 50-day simple moving average and 38.2% Fibonacci retracement level of the greenback’s trading range since June 25. Nevertheless, plunging FOMC rate cut odds could keep providing the US Dollar with a positive tailwind.
US DOLLAR INDEX PRICE CHART: DAILY TIME FRAME (APRIL 15, 2019 TO NOVEMBER 07, 2019)
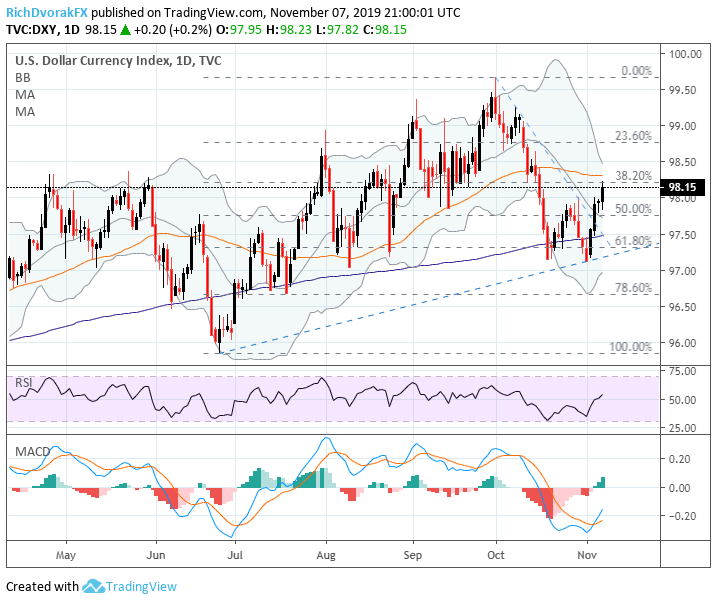
Chart created by @RichDvorakFX with TradingView
Traders will digest the latest US Consumer Sentiment report slated to cross the wires Friday at 14:00 GMT and is set to cap off another busy week of high-impact economic data releases. The previous US Consumer Sentiment report indicated a rebound in the headline figure with the current conditions and future expectations components both showed improvement, which helped deter an influx of recession fears. Likewise, US recession odds continue to shrink driven largely by three-straight FOMC rate cuts and improving US-China trade relations.
CONSUMER SENTIMENT INDEX PRICE CHART (UMICH SURVEY OF CONSUMERS)
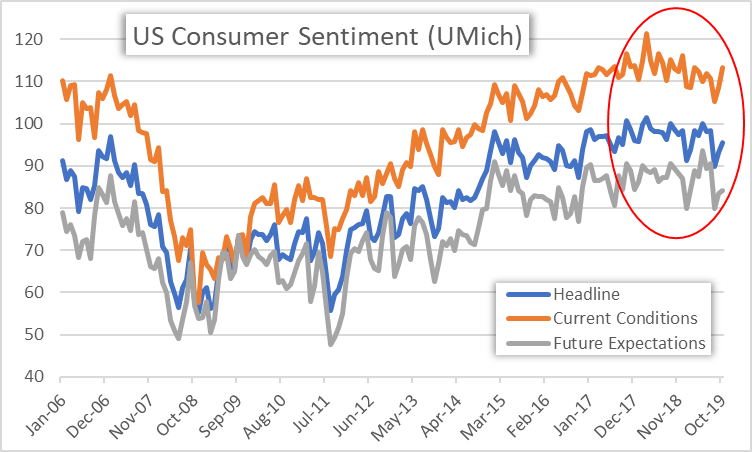
That said, another extension higher in consumer sentiment could be facilitated by the Fed providing more accommodative monetary policy and receding trade war risk. USD price action is expected to continue its recent advance if the UMich Consumer Sentient report indicates that consumers remain optimistic and could reiterate the Fed’s pivot away from its dovish stance. On the contrary, a materially worse-than-expected consumer sentiment report could cause an aggressive repricing of FOMC rate cuts and would likely weigh negatively on the US Dollar. At the same time, however, a sharp rise in recession risk could more broadly keep the US Dollar afloat given its status as a safe-haven currency.
FOMC RATE CUT PROBABILITY (MARCH 2020)
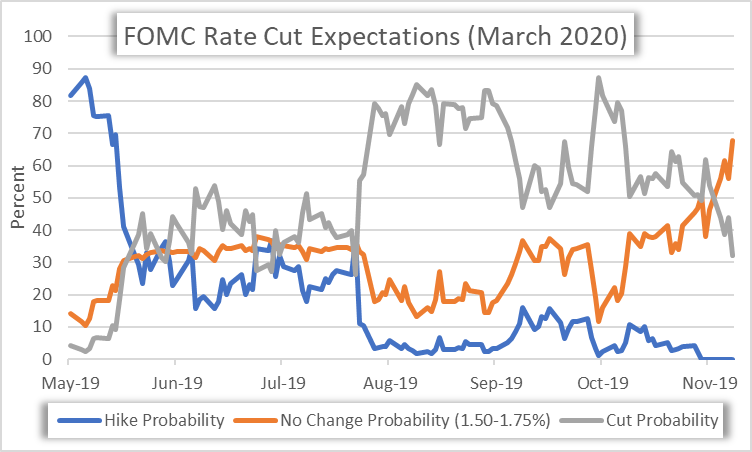
There is currently a 32.1% probability that the FOMC will cut the target Federal funds rate (FFR) by the March 2020 Fed meeting. This is down considerably from the 87.2% probability priced in by rate traders a month ago. Further improvement in US economic data stands to underscore the end of the Fed’s ‘mid-cycle adjustment’ and less-dovish shift in outlook, which would likely be supportive of the US Dollar. Conversely, a breakdown in US-China trade talks or evidence that economic fundamentals continue to deteriorate could send USD price action swooning in response to a rise in FOMC rate cut expectations.
US DOLLAR IMPLIED VOLATILITY & TRADING RANGES
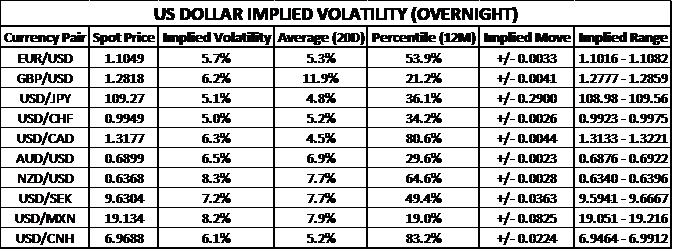
US Dollar implied volatility readings ticked higher headed into Friday’s trading session but remain relatively muted when taken in context. Aside from US Consumer Sentiment figures, the Fed’s Daly will speak at 15:45 GMT whose remarks could cause a sizable reaction in USD price action, though not likely. Nevertheless, USD/JPY, USD/CAD and AUD/USD come into focus owing to the fundamental catalysts on deck with potential to stir US Dollar volatility.
USD/JPY – The market’s reaction to US Consumer Sentiment data could have the cleanest response in spot USD/JPY considering that the forex pair is largely driven by changes in risk appetite and interest rate expectations due to its popular use for the currency carry trade. USD/JPY has surged higher so far this month with spot prices notching the highest reading since May. If implied volatility and extrapolated trading ranges are believed to be true, spot USD/JPY is expected to fluctuate between 108.98-109.56 with a 68% statistical probability judging by the currency pair’s overnight implied volatility reading of 5.1% derived from forex options contracts.
USD/CAD – The loonie will likely be in the spotlight during Friday’s trading session seeing that the latest Canadian Jobs report is due for release at 12:30 GMT. Correspondingly, USD/CAD is prone to experiencing above-average gyrations in spot prices considering the high-impact nature of employment data. USD/CAD is currently hovering near the mid-point retracement of its most recent bearish leg and Friday’s economic data could provide forex traders with enough conviction to send the currency pair toward the upper or lower limit of its options-implied trading range between 1.3133-1.3221. For further insight on USD/CAD check out this Canadian Dollar Forecast – Will the BOC Capitulate & Cut?
AUD/USD – Last but not least the Aussie-Dollar is also postured for above-average volatility with US-China trade headlines dominating AUD/USD price action. Most recently, the Trump administration confirmed its willingness to roll back tariffs on China in a last-minute concession to seal a phase-one trade agreement. Uncertainty surrounding Sino-American trade relations remains at large, however, and could cause an abrupt reversal in spot AUD/USD prices if progress between Washington and Beijing stalls or takes a turn for the worse. AUD/USD is estimated to oscillate between 0.6876-0.6922 judging by its overnight implied volatility of 6.5%, which is below its 20-day average of 6.9%.
-- Written by Rich Dvorak, Junior Analyst for DailyFX.com
Connect with @RichDvorakFX on Twitter for real-time market insight


