


US DOLLAR PRICE OUTLOOK: IMPLIED VOLATILITY & TRADING RANGES FOR NEXT WEEK
- The US Dollar is currently wedged between technical confluence provided by its 50-day and 200-day simple moving averages
- USD price action turns to staggering event risk scheduled for next week with a FOMC rate decision in addition to Q3 US GDP, nonfarm payrolls, inflation and PMI data releases
- Check out the US Dollar Price Volatility Report for daily commentary on the US Dollar with implied volatility and trading ranges included
The US Dollar continues to claw back recent downside with the DXY Index rebounding roughly 0.7% over the last 5 trading days. Nevertheless, there is a plethora of high-impact event risk scheduled for next week that stands to strongarm USD price action.
US DOLLAR INDEX PRICE CHART: DAILY TIME FRAME (MAY 20, 2019 TO OCTOBER 25, 2019)
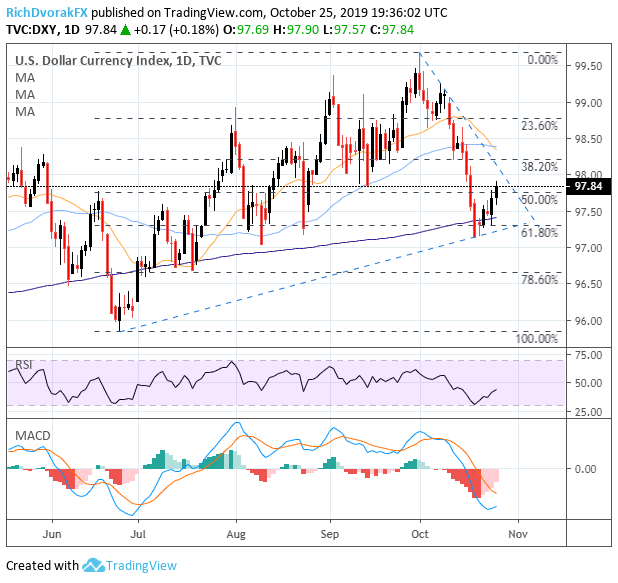
Chart created by @RichDvorakFX with TradingView
The US Dollar Index is currently wedged between technical support provided by its 200-DMA and technical resistance posed by its 50-DMA which will look to keep the greenback roughly contained. A breakout above or below these levels of confluence – likely sparked by a major fundamental catalyst over the coming days – could very well determine the US Dollar’s broader trend.
FOREX ECONOMIC CALENDAR – US DOLLAR
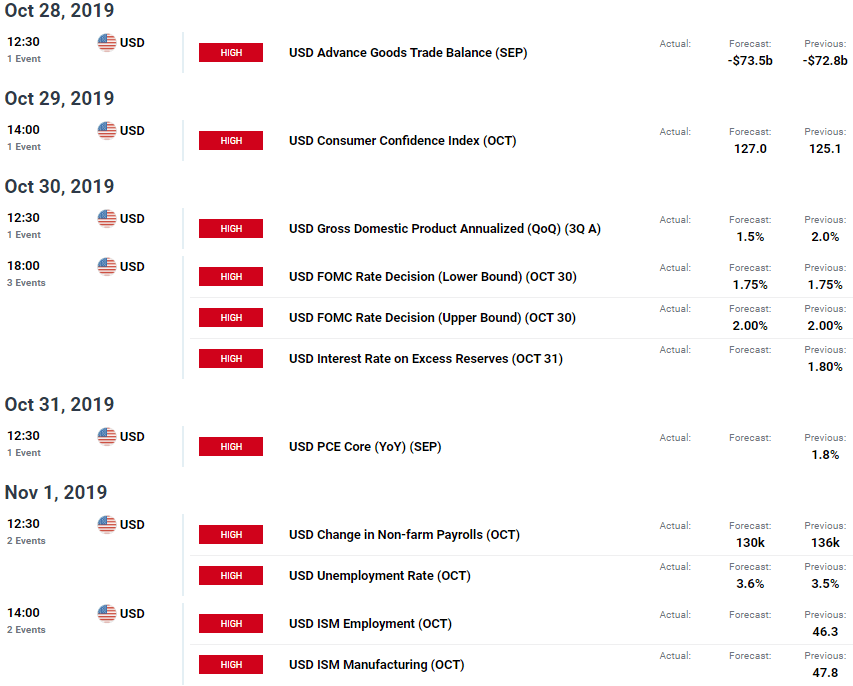
The DailyFX Economic Calendar details the several economic events and data releases that stand to impact the broader market and USD price action. Most notable for the US Dollar next week includes data releases on the trade balance, consumer confidence, Q3 GDP, core PCE, nonfarm payrolls as well as the ISM PMI reports and FOMC rate decision.
US DOLLAR IMPLIED VOLATILIY & TRADING RANGES (1-WEEK)

As has been the case, GBP/USD is expected to be the most volatile US Dollar currency pair next week with an implied volatility of 9.32%, though this is down sizably from last Friday’s reading of 19.78%. USD/JPY implied volatility of 5.40% seems peculiarly low given the currency pair’s sensitivity to changes in interest rate expectations and market sentiment, which could both fluctuate quite materially next week in response to high-impact event risk previously mentioned. Forex traders will likely keep close tabs on EUR/USD, AUD/USD and also USD/CAD considering the high-impact event risk coming out of Europe, Australia and Canada.
US DOLLAR RISK REVERSALS (1-WEEK)

A risk reversal reading above zero indicates that the demand for call option volatility (upside protection) exceeds that of put option volatility (downside protection). For additional insight on market positioning and bullish or bearish biases, traders can turn to the IG Client Sentiment data, which is updated in real-time and covers several currency pairs, commodities, and equity indices.
-- Written by Rich Dvorak, Junior Analyst for DailyFX.com
Connect with @RichDvorakFX on Twitter for real-time market insight


