


US DOLLAR PRICE ACTION EYES DURABLE GOODS DATA, ECB MEETING, TRADE WARS
- Relentless US Dollar selling pressure has pushed the greenback 2.5% lower from this month’s intraday (also year-to-date) swing high
- USD price action looks to fundamental forces like the release of US Durable Goods data, an ECB rate decision and looming trade war headlines expected next week
- Enhance your market knowledge with our free Forecasts & Trading Guides available for download
The US Dollar continues to bleed and the latest technical development suggests that the greenback’s recent selloff will persist. Another day of US Dollar downside has dragged the USD price action through major technical levels yet again. The US Dollar’s sizable selloff this month – and over the last 5 trading days in particular – sent the DXY Index swooning below its rising wedge support line dating back to February 2018.
US DOLLAR INDEX PRICE CHART: WEEKLY TIME FRAME (SEPTEMBER 18, 2017 TO OCTOBER 18, 2019)

Chart created by @RichDvorakFX with TradingView
I pointed out in the daily publication of this US Dollar Price Volatility Report that the greenback’s selloff could continue to gain pace after the DXY Index plunged below the 98.00 price level, which has so far materialized. At the same time, the relentless drop in the US Dollar over the last couple days has pushed the DXY Index to another major technical level that could catapult the greenback higher.
This area of confluence around the 97.00 handle is underpinned by the US Dollar’s 23.6% Fibonacci retracement of its trading range since 2018 in addition to its 50-week simple moving average. If this zone of technical support fails to buoy the US Dollar headed into next week, USD price action could continue to edge lower and potentially target the 100-week EMA and 200-week SMA around the 96.00 price level before eyeing the 38.2% Fib.
US DOLLAR IMPLIED VOLATILITY & TRADING RANGES (1-WEEK)
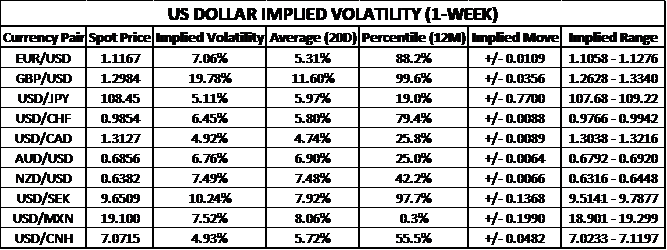
Next week’s fundamental backdrop with US Durable Goods data on deck, which has potential to materially sway FOMC rate cut expectations priced in by traders, could give the US Dollar a much needed jolt if the report tops market estimates. Also, in light of the upcoming ECB meeting and US tariffs taking effect on imported European goods, recent USD price action could quickly reverse higher – or equally extend lower – considering that EUR/USD performance comprises nearly 60% of the popular DXY US Dollar Index.
Nevertheless, GBP/USD is expected to be the most volatile major US Dollar currency pair next week in the wake of British Parliament’s vote on PM Boris Johnson’s brokered Brexit Withdrawal Agreement. Also worth mentioning on the opposite end of the spectrum is USD/MXN 1-week implied volatility of 7.52%, which is its lowest reading in the last 12-months.
US DOLLAR RISK REVERSALS (1-WEEK)

A risk reversal reading above zero indicates that the demand for call option volatility (upside protection) exceeds that of put option volatility (downside protection). For additional insight on market positioning and bullish or bearish biases, traders can turn to the IG Client Sentiment data, which is updated in real-time and covers several currency pairs, commodities, and equity indices.
-- Written by Rich Dvorak, Junior Analyst for DailyFX.com
Connect with @RichDvorakFX on Twitter for real-time market insight


