


US Dollar Forecast Overview:
- The US Dollar (via the DXY Index) is rallying towards its yearly high established at the start of September at 99.37; if it closes above 99.04, there will be a fresh closing high in place.
- Fed funds are pricing in a 50% chance of a 25-bps rate cut in October; there is a 75% chance of a cut by the end of the year. Odds of 50-bps of cuts by the December 2019 meeting are only 25%.
- Retail trader positioning suggests that the combination of current sentiment and recent changes gives us a stronger USDJPY-bearish contrarian trading bias.
Looking for longer-term forecasts on the US Dollar? Check out the DailyFX Trading Guides.
The week after the September Fed meeting initially produced great volatility, but not much direction, for the US Dollar. But as Fed rate cut expectations pullback amid the truce in the US-China trade war, the DXY Index has been able to unshackle itself from the “race to the bottom” among the G10 currencies’ central banks. Now that the end of the month and quarter is upon us, and the September US nonfarm payroll report coming into focus next Friday, traders should be anticipating more volatility across USD-pairs.
US Treasury Yield Curve Shifts Lower
With the US-China trade war ina short-term truce, US Treasury yields have been able to recover ground in recent weeks. In fact, the scope and scale of the US Treasury yield rally since the start of September has seen the US yield curve move out of inversion territory at key points; it would stand to reason that near-term US recession odds are dropping as well.
US Treasury Yield Curve: 1-month to 30-years (September 26, 2019) (Chart 1)

Parallel shifts in short-end and long-end rates suggest that investors’ expectations for the Fed’s rate cut cycle haven’t changed significantly over the past week. Moreover, the shifts in the US Treasury yield curve in recent weeks not only suggests that the Fed rate cycle won’t be as deep as previously envisioned, but that concerns over an immediate US recession are fading too.
The Fed Rate Cut Cycle PricingRemains Soft
Fed funds are pricing in an 50% chance of a 25-bps rate cut in Octoberbut only25% chance of 50-bps of rate cuts by the end of the year. However, odds of a 25-bps rate cut by December remain firm around 75%.
Federal Reserve Interest Rate Expectations (September 26, 2019) (Table 1)
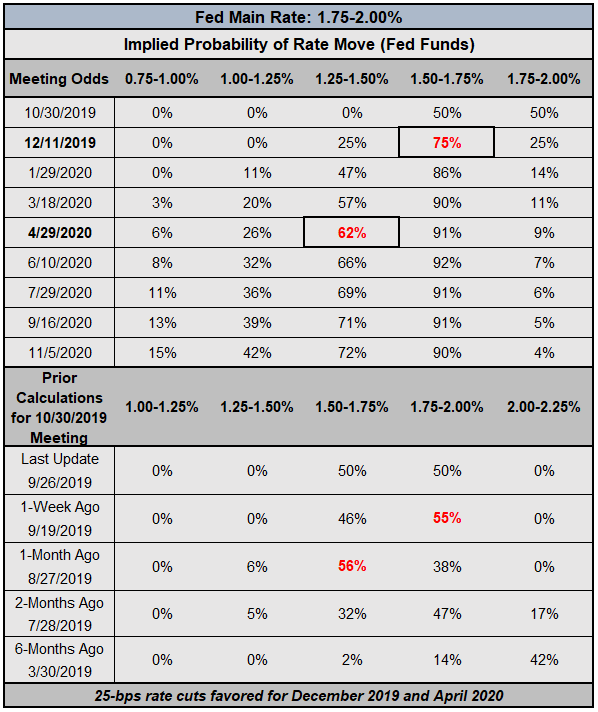
Rate cut odds have faded in the week following the September Fed meeting. One week ago, there was a 55% chance of a 25-bps rate cut in October; one month ago, there was a 56% chance. It would appear the next Fed rate cut is a question of “when,” not “if” – a rate cut will come in one of the last two meetings of 2019.
Eurodollar Contracts Concur with Fed Funds About Cut Cycle
We can measure whether a rate cut is being priced-in using Eurodollar contracts by examining the difference in borrowing costs for commercial banks over a specific time horizon in the future. Eurodollar contracts continue to be closely aligned with Fed funds regarding the scope and scale of the Fed rate cut cycle.
The chart below showcases the difference in borrowing costs – the spreads – for the continuous front month/January 20 (orange) and the continuous front month/June 20 (blue), in order to gauge where interest rates are headed in the December 2019 Fed meeting and the June 2020 Fed meeting.
Eurodollar Contract Spreads – Continuous Front Month/January 20 (Orange), Continuous Front Month/June 20 (Blue) (March 2019 to September 2019) (Chart 2)
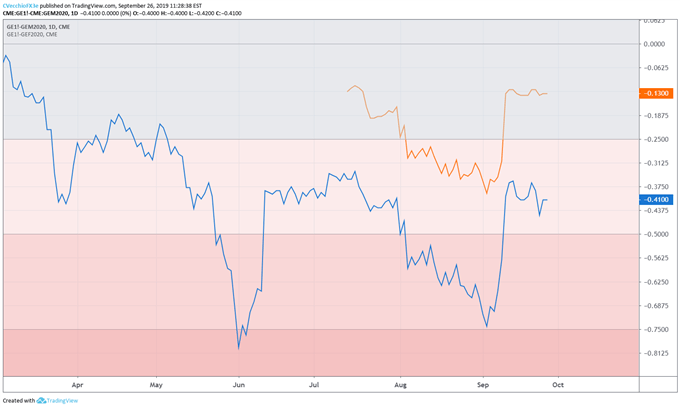
Based on the Eurodollar contract spreads, there is a 52% chance of a 25-bps rate cut by the end of the year – less aggressive than Fed fund’s 75% pricing. Prior to the September Fed meeting, Eurodollar contract spreads were discounting a 56% chance of a final 25-bps rate cut by the end of the year. Overall, there is a 64% chance of 50-bps of rate cuts by June 2020.
DXY PRICE INDEX TECHNICAL ANALYSIS: DAILY CHART (September 2018 to September 2019) (CHART 3)
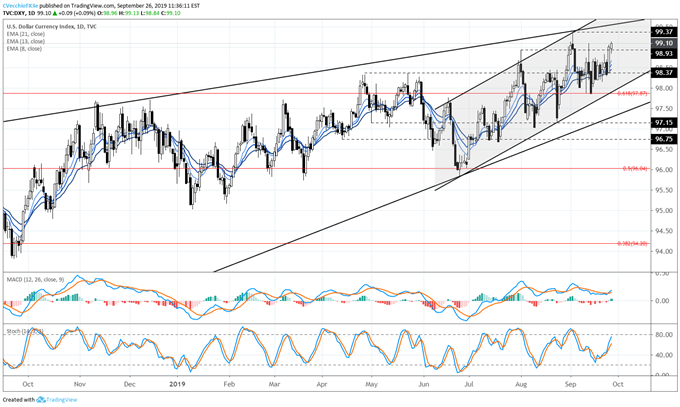
There’s no other way to describe the situation at hand: the DXY Index has proven incredibly resilient in recent days. The return to the 61.8% retracement of the 2017 high/2018 low range at 97.87 proved to be a minor setback, and the ascending channel in place since June remains intact.
To this end, the DXY Index’s bullish momentum profile has strengthened in recent days. Price is firmly above the daily 8-, 13-, and 21-EMA envelope, which is in bullish sequential order. Daily MACD continues to has issued a buy signal in bullish territory, while Slow Stochastics are quickly advancing to overbought territory. Above 99.04, there will be a fresh closing high in place for the DXY Index with little standing in the way of a run to the yearly high at 99.37.
USDJPY RATE TECHNICAL ANALYSIS: DAILY CHART (September 2018 to September 2019) (CHART 4)

USDJPY has not made much progress after achieving several significant technical progressions to the topside in early-September: breaking above the June low and 76.4% retracement of the 2018 to 2019 high/low range near 106.78/97; and the descending trendline from the April 24 and July 10 swing highs.
Since then, USDJPY rates have been trapped between the 61.8% retracement of the 2018 to 2019 high/low range near 108.42 and the 76.4% retracement of the 2018 to 2019 high/low range near 106.78/97. A move through 108.42/50 would increase the likelihood that USDJPY rates would return to a 30-pip area around the May 10 swing low and August 1 bearish outside engulfing bar high near 109.02/32. A move below the weekly low at 107.45 would suggest a false breakout has transpired in USDJPY.
IG Client Sentiment Index: USDJPY RATE Forecast (September 26, 2019) (Chart 5)
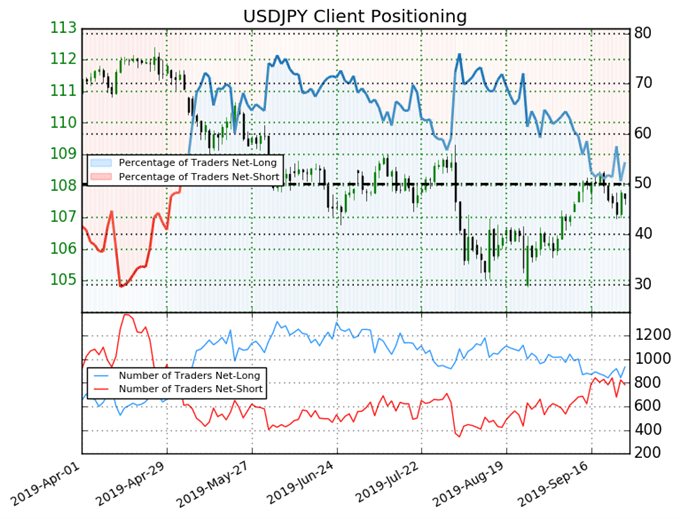
USDJPY: Retail trader data shows 54.4% of traders are net-long with the ratio of traders long to short at 1.19 to 1. The number of traders net-long is 4.6% higher than yesterday and 4.4% higher from last week, while the number of traders net-short is 6.0% lower than yesterday and 4.2% lower from last week.
We typically take a contrarian view to crowd sentiment, and the fact traders are net-long suggests USDJPY prices may continue to fall. Traders are further net-long than yesterday and last week, and the combination of current sentiment and recent changes gives us a stronger USDJPY-bearish contrarian trading bias.
FX TRADING RESOURCES
Whether you are a new or experienced trader, DailyFX has multiple resources available to help you: an indicator for monitoring trader sentiment; quarterly trading forecasts; analytical and educational webinars held daily; trading guides to help you improve trading performance, and even one for those who are new to FX trading.
--- Written by Christopher Vecchio, CFA, Senior Currency Strategist
To contact Christopher Vecchio, e-mail at cvecchio@dailyfx.com
Follow him on Twitter at @CVecchioFX
View our long-term forecasts with the DailyFX Trading Guides


