


US DOLLAR CURRENCY VOLATILITY REMAINS ELEVATED AFTER FED DECISION
- The US Dollar whipsawed in the run-up to the FOMC rate cut and oscillated during Fed Chair Powell’s press conference speech as forex traders digested the latest central bank decision
- USD price action has potential to target fresh year-to-date highs after the September Fed meeting revealed an upbeat tone on the US economy and relatively hawkish outlook
- Check out the Most Volatile Currency Pairs and How to Trade Them
US Dollar price action has pushed the greenback higher on balance in the aftermath of the September FOMC rate decision. The Federal Reserve lowered its benchmark interest rate by 25 basis points for the second time this year, which brings the current target range down to 1.75-2.00%. Despite providing further monetary policy accommodation, the US Dollar took the latest Fed rate cut in stride and staged strong rebound off session lows immediately after the central bank’s announcement.
DXY US DOLLAR INDEX PRICE CHART: DAILY TIME FRAME (APRIL 23, 2019 TO SEPTEMBER 18, 2019)
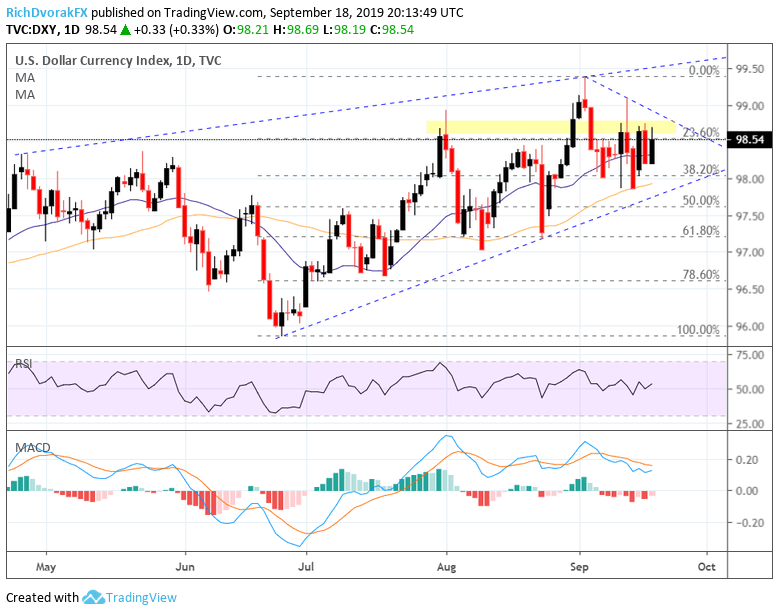
Chart created by @RichDvorakFX with TradingView
As Wednesday’s trading session winds down and the dust settles following the September Fed meeting, the US Dollar is on pace to close nearly 0.5% higher measured via the DXY Index – a popular basket of USD currency pairs used to track the greenback’s performance. The bounce in the US Dollar and DXY Index has resulted in bullish divergence judging by the MACD indicator and also pushed the RSI back above 50, which suggests USD price action may continue to march higher on balance. While the US Dollar reaffirmed its footing above its 20-DMA once again – which we have been closely monitoring in our daily US Dollar price volatility reports – clear technical resistance has formed around the 98.50-98.75 price zone highlighted above.This level of confluence is also underscored by the 23.6% Fibonacci retracement of the US Dollar’s bullish leg since late June.
Clearing this area of resistance will be a constructive development if the US Dollar is to continue upward momentum post-FOMC. Beyond that, the short-term downtrend line formed by the September 3 and September 9 swing highs could hinder upside progression. On the other hand, if bullish US Dollar prospects wane as markets digest the latest FOMC rate cut and outlook from the Federal Reserve, the currency may look to technical support likely provided by its 50-DMA, 38.2% Fibonacci retracement and bullish trendline drawn from the June 25 and August 23 swing lows.
US DOLLAR IMPLIED VOLATILITY (OVERNIGHT)
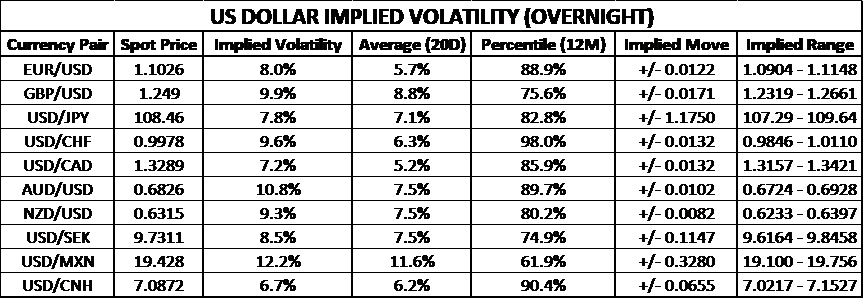
With the Fed’s monetary policy update for September now in the rearview mirror, forex traders can turn to the DailyFX Economic Calendar to identify event risk that should be kept on the radar. Most notable over the next 24-hours draws attention to AUDUSD as well as USDJPY and USDCHF. Aussie employment data on deck could spark a serious move in spot AUDUSD, particularly if the data disappoints, as it may exacerbate recent US Dollar strength.
Equally important for AUDUSD is diligent monitoring of US-China trade war developments and any remarks from President Trump regarding trade talks, tariffs, or even hints of currency intervention. At the same time, USDJPY and USDCHF are both primed for big moves in spot prices as the currency pairs face central bank decisions from the BOJ and SNB. On that note, we have previously brought attention to the potential for USDCHF trend continuation.
US DOLLAR RISK REVERSALS (OVERNIGHT)

Also, worth mentioning is that the sustained high implied volatility readings with the Fed on the backburner (at least for now) could suggest that the market has not fully digested the updated FOMC economic projections and latest commentary from Chair Powell – i.e. heightened potential for USD price action follow-through as the week progresses.
This possibility is also hinted at by the recent changes in US Dollar risk reversal measures, which points to forex option traders’ growing bullish bias for the greenback. A reading above 0 indicates that demand for options is skewed in favor of calls (i.e. upside protection) whereas a reading below 0 indicates that demand for put options is greater (i.e. downside protection). That said, take a look at historical data on How Gold, Oil, Stocks & USD Perform After FOMC Rate Cuts Start.
-- Written by Rich Dvorak, Junior Analyst for DailyFX.com
Connect with @RichDvorakFX on Twitter for real-time market insight


