Crude Oil Price Talking Points
The price of oil is little changed from the start of the week even as the Organization of Petroleum Exporting Countries (OPEC) revert to their previous production schedule, but failure to test the August low ($85.73) may keep crude afloat as it snaps series of lower highs and lows from last week.
Crude Oil to Stage Near-Term Rebound on Failure to Test August Low
The price of oil manages to hold above the monthly low ($85.98) as OPEC emphasizes the “upward adjustment of 0.1 mb/d to the production level was only intended for the month of September 2022,” and it seems as though the group will no longer boost output in 2022 as “higher volatility and increased uncertainties require the continuous assessment of market conditions.”
The decision by OPEC and its allies may limit the downside risk for crude as the group appears to be on a preset path in managing supply, but signs of slowing consumption may continue to drag on the price of oil as the most recent Monthly Oil Market Report (MOMR) warns that “for 2022, world oil demand is foreseen to rise by 3.1 mb/d, a downward revision of 0.3 mb/d from last month’s estimate.”
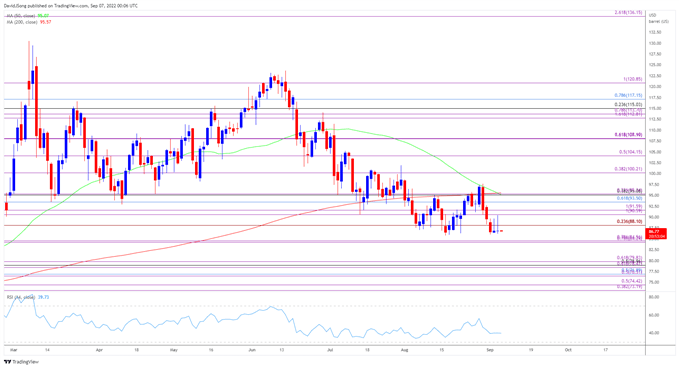
With that said, the price of oil may face headwinds ahead of the next Ministerial Meeting on October 5 as it appears to be tracking the negative slope in the 50-Day SMA ($95.07), but lack of momentum to test the August low ($85.73) may foster a near-term rebound in crude as it snaps series of lower highs and lows from last week.
Crude Oil Price Daily Chart

Source: Trading View
- The price of oil falls back towards the August low ($85.73) after testing the 50-Day SMA ($95.07) during the previous month, with a break below the former-resistance zone around the October 2021 high ($85.41) bringing the $84.20 (78.6% expansion) to $84.60 (78.6% expansion) region on the radar.
- Next area of interest coming in around $78.50 (61.8% expansion) to $79.80 (61.8% expansion), but failure to test the August low ($85.73) may push the price of oil back towards the $90.60 (100% expansion) to $91.60 (100% expansion) region as it snaps the series of lower highs and lows from last week.
- Need a break/close above the $90.60 (100% expansion) to $91.60 (100% expansion) region to open up the Fibonacci overlap around $93.50 (61.8% retracement) to $95.30 (23.6% expansion), but the price of oil may largely track the negative slope in the 50-Day SMA ($95.07) to largely mirror the price action from the previous month.


--- Written by David Song, Currency Strategist
Follow me on Twitter at @DavidJSong


