


Crude Oil Price Talking Points
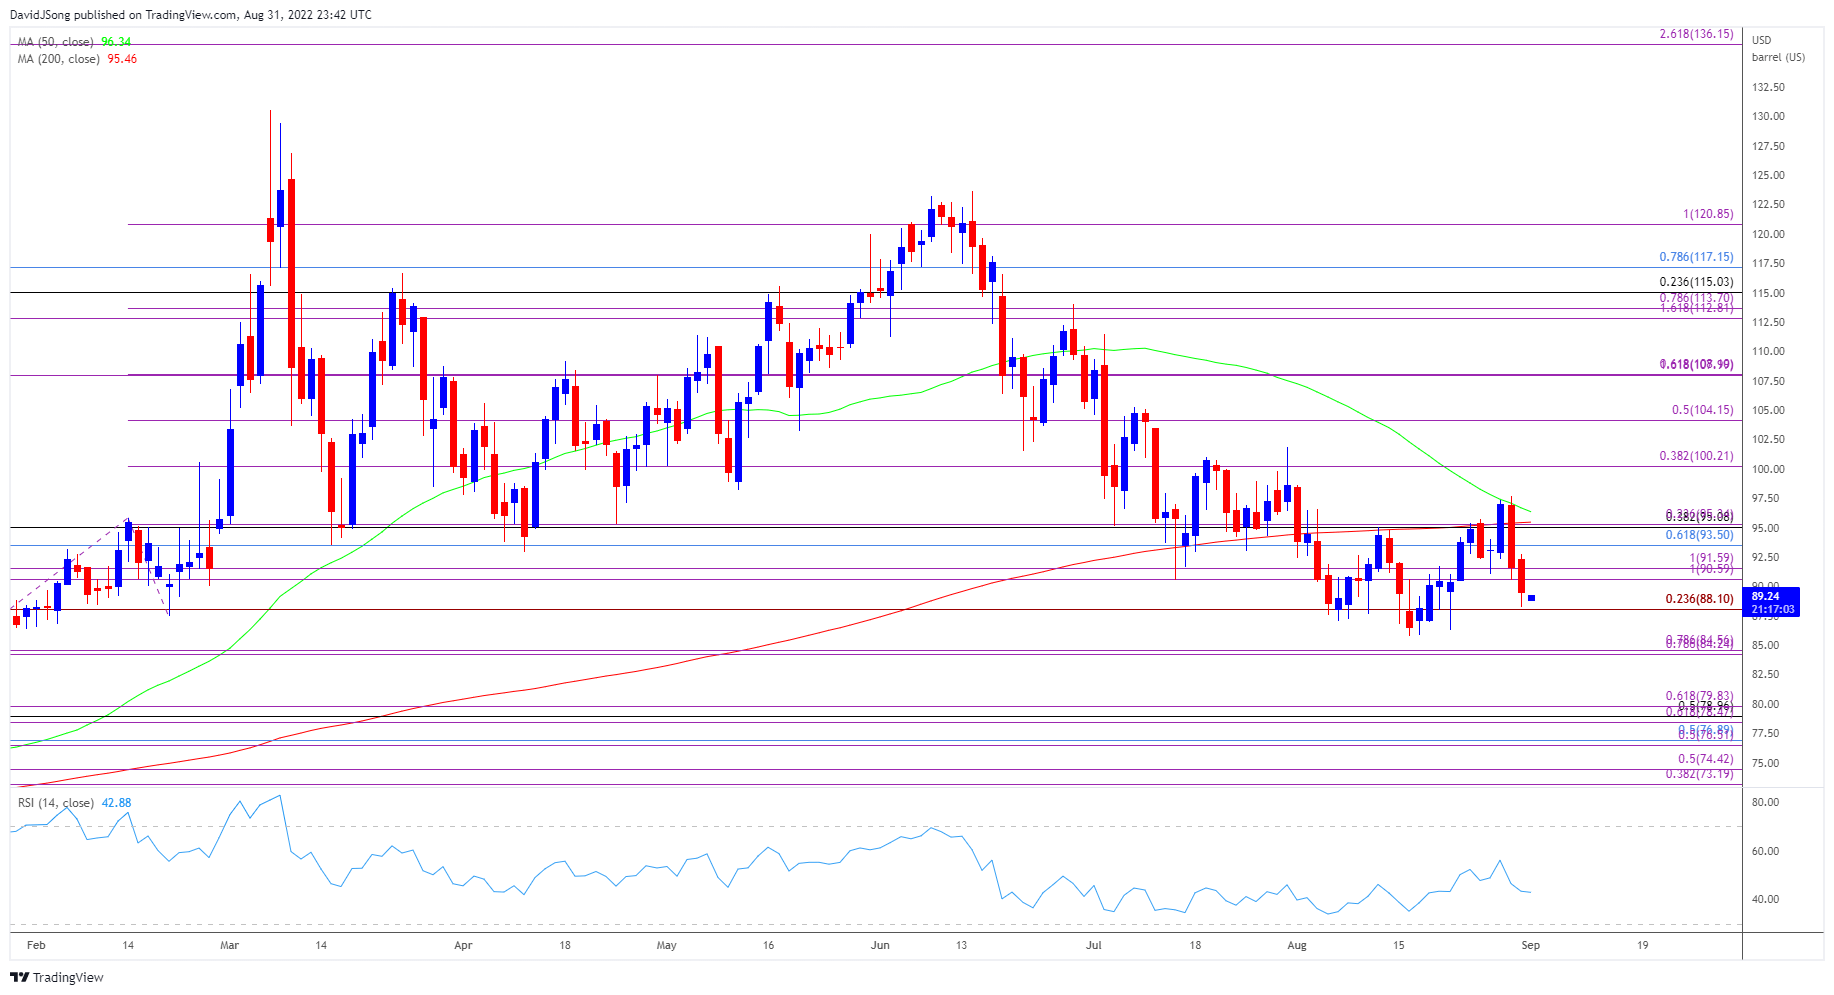
The price of oil trades to a fresh weekly low ($88.27) despite a larger-than-expected decline in US inventories, and crude may continue to give back the advance from the monthly low ($85.73) as it appears to be reversing course after testing the 50-Day SMA ($96.34).
Crude Oil Price Rebound Unravels After Testing 50-Day SMA
The price of oil seems to be responding to the negative slope in the moving average as it falls for a second day, and crude may face a further decline over the coming days as it appears to be unfazed by the fresh developments coming out of the US.
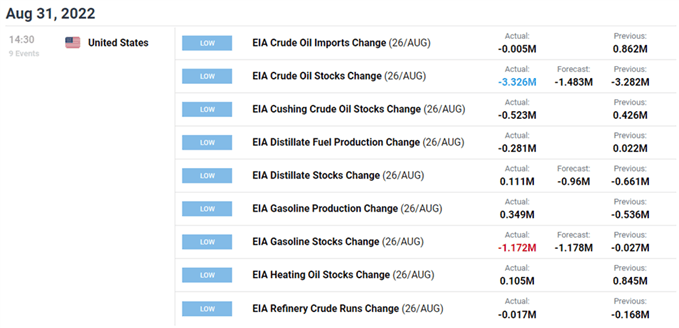
Nevertheless, the data prints may influence the Organization of Petroleum Exporting Countries (OPEC) as the 3.326M decline in US inventories points to robust demand, and it remains to be seen if the group will adjust the output schedule at the next Ministerial Meeting on September 5 as the most recent Monthly Oil Market Report (MOMR) warns that “for 2022, world oil demand is foreseen to rise by 3.1 mb/d, a downward revision of 0.3 mb/d from last month’s estimate.”
Until then, the price of oil may struggle to retain the advance from the monthly low ($85.73) as OPEC plans to “increase output by “0.1 mb/d for the month of September 2022,” and expectations for greater supply may generate headwinds for crude amid the rebound in US production.
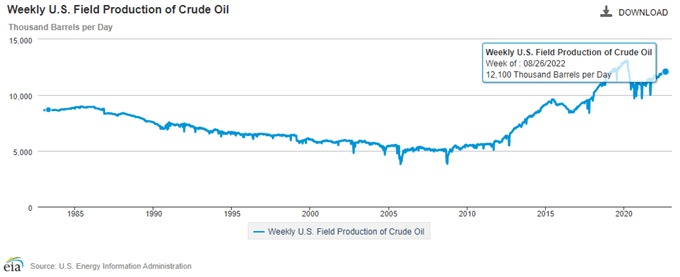
A deeper look at the figures from the Energy Information Administration (EIA) show weekly field output widening to 12,100K in the week ending August 26 from 12,000K the week prior, and signs of stronger-than-expected demand along with indications of higher supply may keep the price of oil under pressure should OPEC stick to its current production schedule.
With that said, the price of oil may face a further decline over the coming days as it initiates a series of lower highs and lows, and the advance from the monthly low ($85.73) may continue to unravel ascrude seems to be responding to the negative slope in the 50-Day SMA ($96.34).
Crude Oil Price Daily Chart
Source: Trading View
- The price of oil cleared the opening range for August after finding support ahead of the former-resistance zone around the October 2021 high ($85.41), but crude trades back below the $90.60 (100% expansion) to $91.60 (100% expansion) region as it carves a series of lower highs and lows.
- The advance from the monthly low ($85.73) may continue to unravel as the price of oil seems to be responding to the negative slope in the 50-Day SMA ($96.34), but need a break/close below $88.10 (23.6% expansion) to raise the scope for a further decline in crude.
- Failure to defend the former-resistance zone around the October 2021 high ($85.41) may push the price of oil towards the $84.20 (78.6% expansion) to $84.60 (78.6% expansion) region, with the next area of interest coming in around $78.50 (61.8% expansion) to $79.80 (61.8% expansion).

--- Written by David Song, Currency Strategist
Follow me on Twitter at @DavidJSong


