


Gold Price Talking Points
The price of gold slips to a fresh monthly low ($1720) as it carves a series of lower highs and lows, and bullion may continue to give back the rebound from the yearly low ($1681) as it struggles to push back above the 50-Day SMA ($1763).
Gold Price Outlook Mired by Failure to Push Back Above 50-Day SMA
The price of gold struggles to hold its ground as Federal Reserve Chairman Jerome Powell pledges to implement higher interest rates over the coming months, and the precious metal may largely track the negative slope in the moving average as the central bank prepares US households and businesses for a restrictive policy.
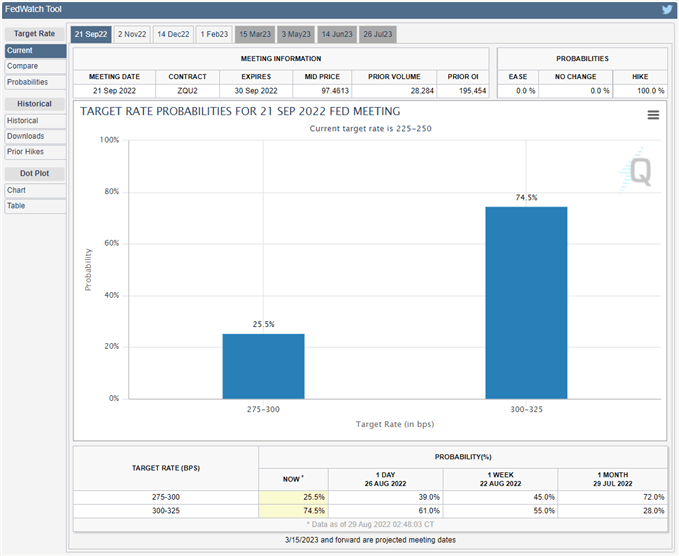
Source: CME
The Federal Open Market Committee (FOMC) may stick to its current approach in combating inflation as the CME FedWatch Tool now reflects a greater than 70% probability for a 75bp rate hike, and it remains to be seen if the central bank will continue to strike a hawkish forward guidance at its next interest rate decision on September 21 as Chairman Powell and Co. are slated to update the Summary of Economic Projections (SEP).
Until then, speculation surrounding the next Fed meeting may influence the price of gold as the recent weakness in the precious metal appears to be accompanied by a rise in US Treasury yields, and bullion may face headwinds throughout the remainder of the year as the central bank sticks to its hiking-cycle.
With that said, the price of gold may struggle to retain rebound from the yearly low ($1681) amid growing speculation for another 75bp rate hike, and the precious metal may largely track the negative slope in the 50-Day SMA ($1763) as it struggles to push back above the moving average.
Gold Price Daily Chart
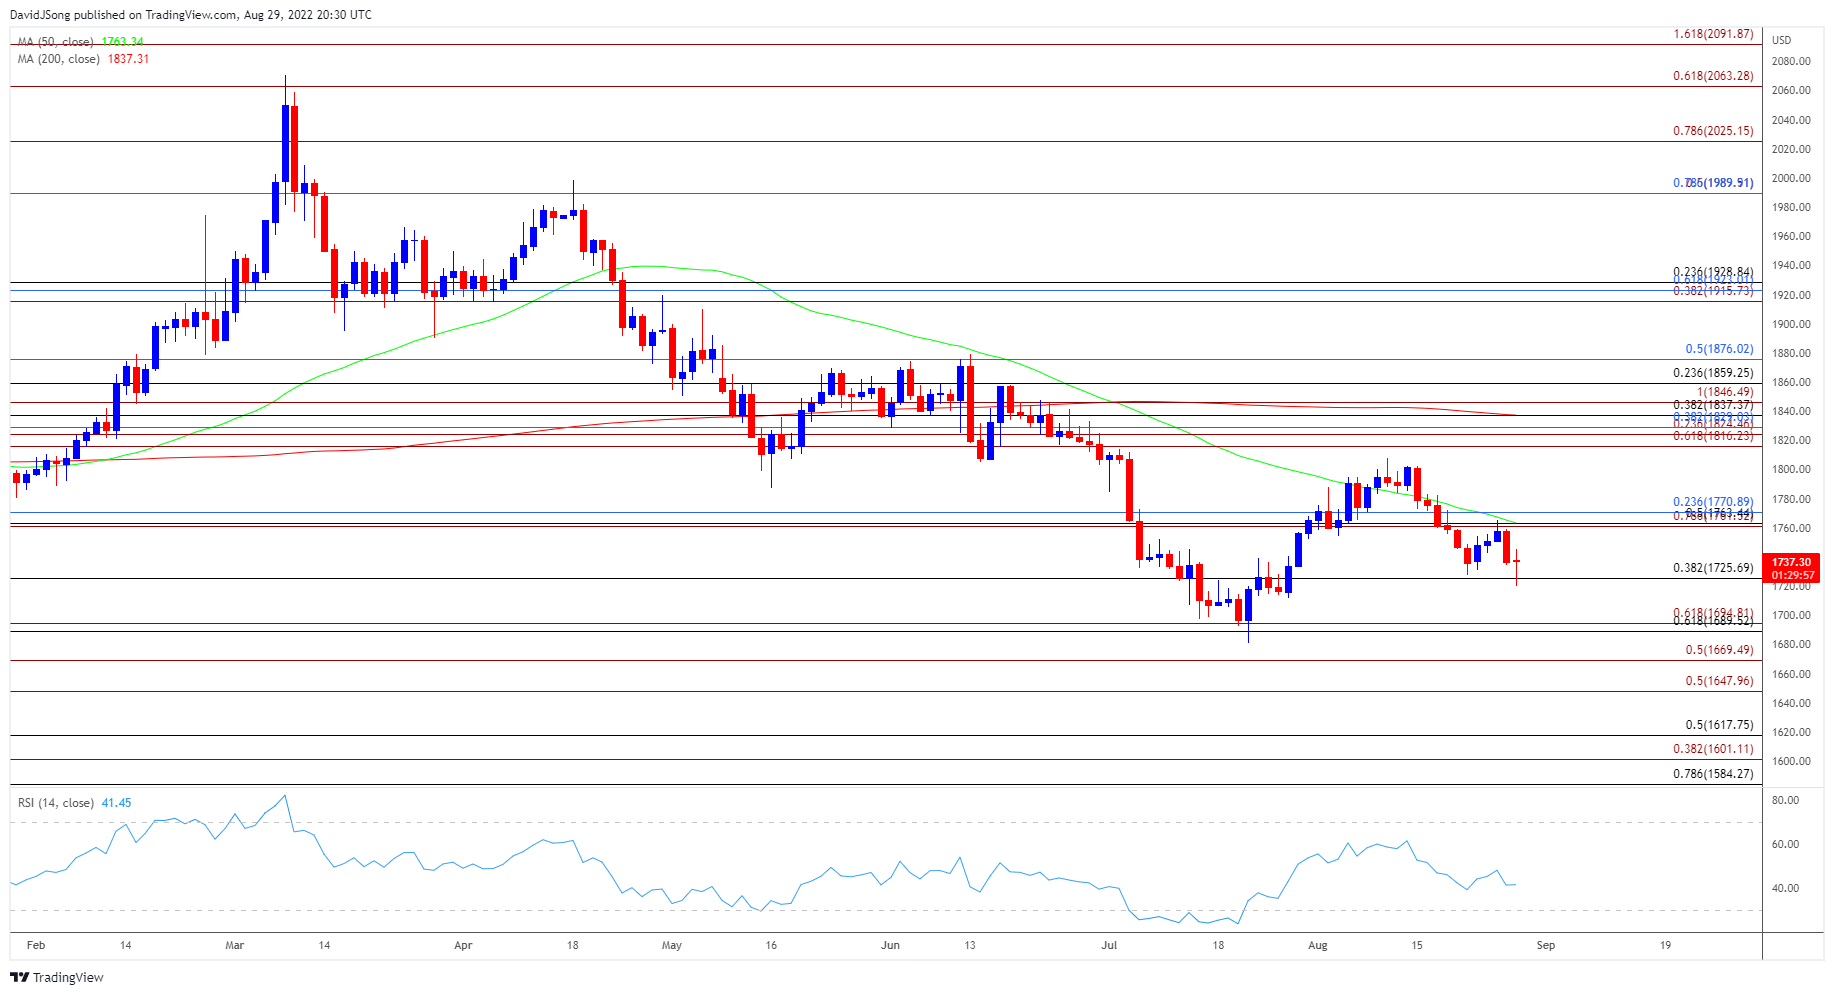
Source: Trading View
- The price of gold carves a series of lower highs and lows after failing to push back above the 50-Day SMA ($1763), and bullion may track the negative slope in the moving average as it trades to a fresh monthly low ($1720) going into the end of August.
- Need a close below $1726 (38.2% retracement) to bring the $1690 (61.8% retracement) to $1695 (61.8% expansion) area on the radar, with a break of the yearly low ($1681) opening up the $1670 (50% expansion) region.
- However, the price of gold may stage another attempt to push back above the moving average if it fails to close below $1726 (38.2% retracement), with a move above the Fibonacci overlap around $1761 (78.6% expansion) to $1771 (23.6% retracement) bringing the monthly high ($1808) on the radar.

--- Written by David Song, Currency Strategist
Follow me on Twitter at @DavidJSong


