


Gold Price Talking Points
The price of gold bounces back from a fresh weekly low ($1832) as it attempts to retrace the decline following the slowdown in the US Consumer Price Index (CPI), but the recent series of lower highs and lows in bullion raises the scope for a further decline as it snaps the opening range for May.
Gold Price Forecast: Bullion Snaps Opening Range for May
The price of gold tests the 200-Day SMA ($1836) for the first time since February after gapping lower at the start of the week, and failure to hold above the moving average may push the precious metal towards the February low ($1789) as expectations for higher interest rates saps the appeal of bullion.
Recent remarks from New York Fed President John Williams suggest the central bank will take additional steps to tame inflation as the permanent voting member on the Federal Open Market Committee (FOCM) pledges to “move expeditiously in bringing the federal funds rate back to more normal levels this year,” and the mild slowdown in the US CPI may do little to influence the FOMC as it remains at its highest level since 1982.
In turn, expectations for a further shift in Fed policy may continue to drag on the price of gold with the central bank on track to wind down its balance sheet starting next month, and it seems as though the FOMC will deliver another 50bp rate hike at its next interest rate decision on June 15 in an effort to combat inflation.
With that said, the price of gold may face a further decline over the coming day as carves a series of lower highs and lows, and failure to hold above the 200-Day SMA ($1836) may push the precious metal toward the February low ($1789) as it snaps the opening range for May.
Gold Price Daily Chart
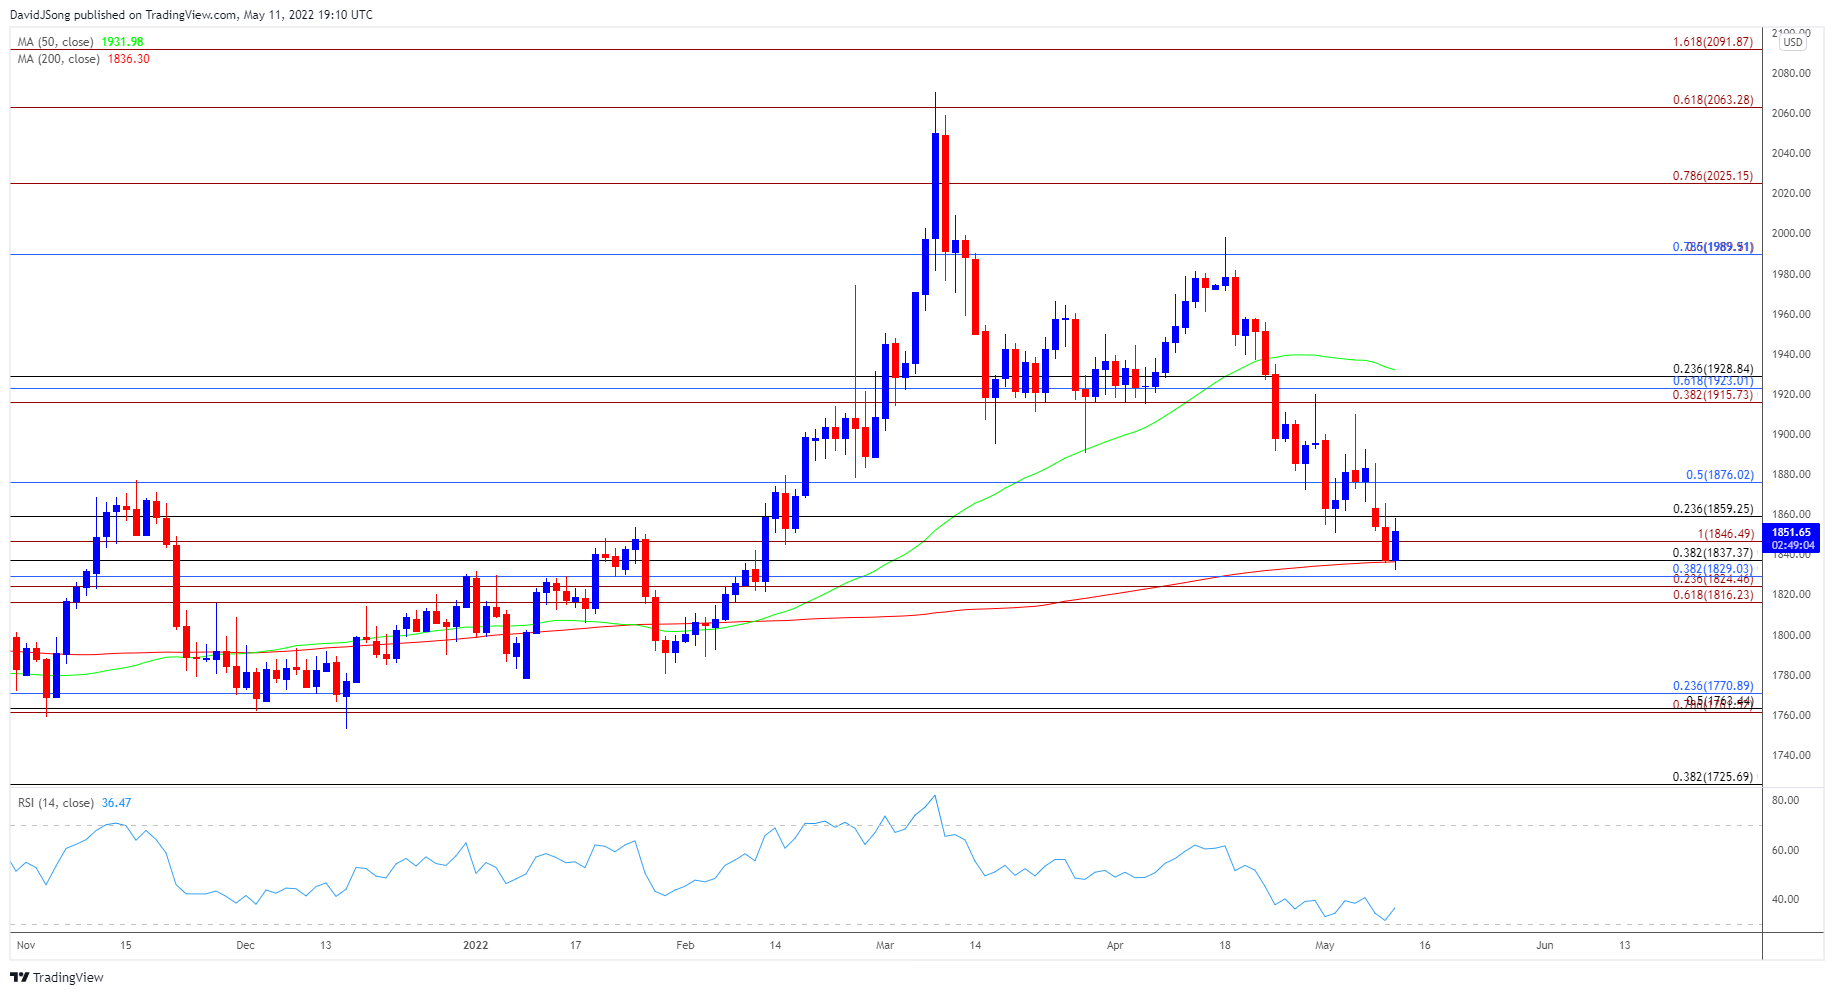
Source: Trading View
- Keep in mind, the price of gold cleared the March low ($1890) as it pushed below the 50-Day SMA ($1932) for the first time since February, with bullion now testing the 200-Day SMA ($1836) after failing to defend the opening range for May.
- Lack of momentum to hold above the moving average may push the price of gold towards the $1825 (23.6% expansion) to $1829 (38.2% retracement) area as it carve a series of lower highs and lows, with a break/close below the $1816 (61.8% expansion) region bringing the February low ($1789) on the radar.
- However, failure to push below the 200-Day SMA ($1836) may curb the recent series of lower highs and lows in the price of gold, with a close above the $1859 (23.6% retracement) area opening up the $1876 (50% retracement) region.
- Will keep a close eye on the Relative Strength Index (RSI) as it flirts with oversold territory, but failure to push below 30 may accompany a larger rebound in the price of gold as the bearish momentum abates.

--- Written by David Song, Currency Strategist
Follow me on Twitter at @DavidJSong


