


Gold Price Talking Points
The price of gold trades to a fresh yearly high ($1921) after showing a limited reaction to the US sanctions on Russia, and the precious metal appears to be on track to test the 2021 high ($1959) as the Relative Strength Index (RSI) pushes into overbought territory for the first time this year.
Gold Price Rally Pushes RSI Into Overbought Zone for First Time in 2022
The price of gold may continue to trade to fresh 2022 highs amid the weakness in global equity prices, and a further deterioration in risk appetite may keep the precious metal afloat as the S&P 500 falls for four of the last five sessions.
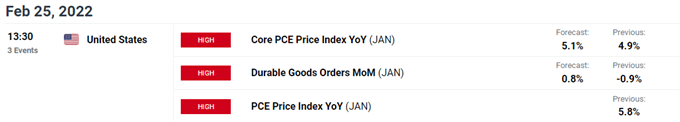
At the same time, fresh data prints coming out of the US may prop up the price of gold as the update to the Personal Consumption Expenditure (PCE) Price Index is anticipated to increase for the fifth consecutive month, with the Federal Reserve’s preferred gauge for inflation seen widening to 5.1% from 4.9% per annum in December, which would mark the highest reading since 1983.
Another uptick in the US PCE may fuel the recent advance in the price of gold as market participants hedge against inflation, and the bullish price action may persist ahead of the Federal Reserve interest rate decision on March 16 as the RSI pushes into overbought territory for the first time in 2022.
With that said, the price of gold looks poised to test the June 2021 high ($1917) after clearing the November high ($1877), and the bullish momentum may persist over the remainder of the month as long as the RSI holds above 70.
Gold Price Daily Chart
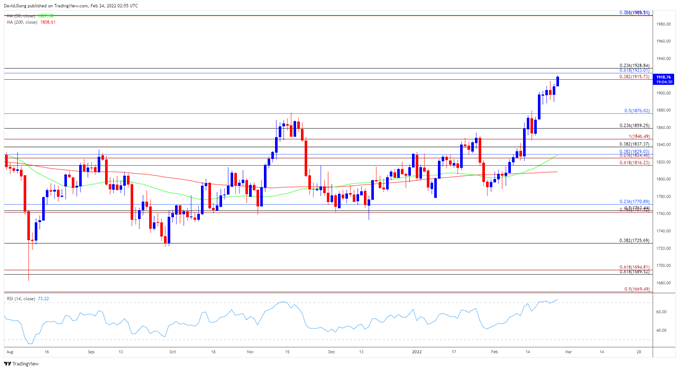
Source: Trading View
- The broader outlook for the price of gold is becoming bullish as it clears the opening range for 2022 in February, with bullion taking out the June 2021 high ($1917) as the Relative Strength Index (RSI) climbs above 70 for the first time this year.
- At the same time, the 50-Day SMA ($1828) now reflects a positive as it moves away from the 200-Day SMA ($1809), and the bullish momentum may persist as long as the RSI holds in overbought territory.
- Need a break/close above the Fibonacci overlap around $1916 (38.2% expansion) to $1929 (23.6% retracement) to bring the 2021 high ($1959) on the radar, with a move above the November 2020 high ($1966) opening up the $1990 (78.6% retracement) region).
- However, failure to break/close above the overlap around $1916 (38.2% expansion) to $1929 (23.6% retracement) may push the price of gold back towards the $1876 (50% retracement) region, with a move below 70 in the RSI likely to be accompanied by a near-term pullback in bullion.

--- Written by David Song, Currency Strategist
Follow me on Twitter at @DavidJSong


