


Oil Price Talking Points
The price of oil recovers from a fresh weekly low ($69.39) amid a larger-than-expected decline in US inventories, and crude may stage a larger rebound over the coming days if it clears the series of lower highs and lows from earlier this week.
Oil Prices Holds Above 200-Day SMA Amid Sharp Decline in US Crude Inventories
The price of oil appears to have reversed course ahead of the August low ($61.74) as it trades back above the 200-Day SMA ($70.27), and crude may attempt to test the monthly high ($73.34) as long as it holds above the moving average.
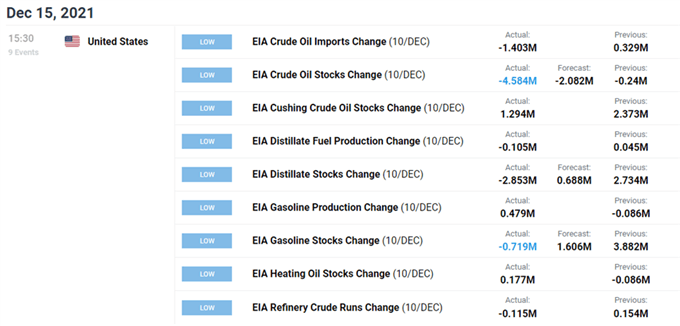
US stockpiles narrowed 4.584M in the week ending December 10 after falling 0.24M the week prior, and the development largely aligns with the fresh projections coming out of the Organization of Petroleum Exporting Countries (OPEC) as the most recent Monthly Oil Market Report (MOMR) reveals that “in 2021, world oil demand growth is unchanged from last month’s assessment at 5.7 mb/d.”
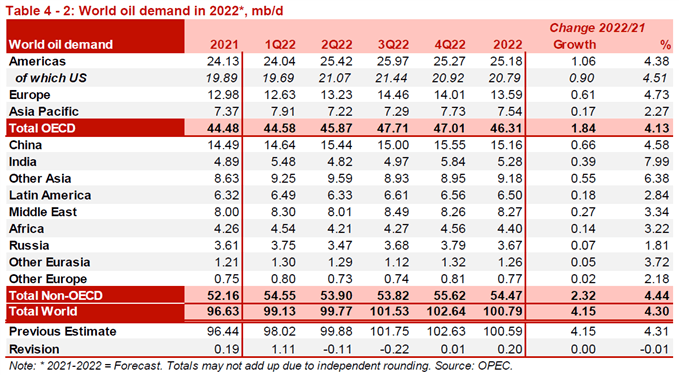
The report going onto say that “in 2022, world oil demand growth was also kept unchanged at 4.2 mb/d and total global consumption at 100.6 mb/d,” and it seems as though OPEC and its allies will retain a gradual approach in restoring production as “the impact of the new Omicron variant is projected to be mild and short-lived, as the world becomes better equipped to manage COVID-19 and its related challenges.”
As a result, expectations for stronger demand may keep oil prices afloat as OPEC and its allies remain reluctant to push output towards pre-pandemic levels, and data prints coming out of the US may highlight a similar dynamic as production holds steady in December.
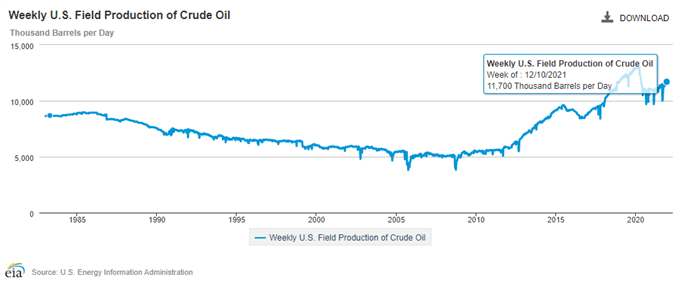
A deeper look at the figures from the Energy Information Administration (EIA) shows weekly field production sitting at 11,700K for the second week, which remains well below the record high print of 13,100 in March 2020, and current market conditions may keep crude prices afloat as expectations for stronger demand are met with indications of limited supply.
With that said, the price of oil may try to stage a larger recovery over the remainder of the year as the advance from the monthly low ($62.43) pulls the Relative Strength Index (RSI) out of oversold territory to trigger a textbook buy signal.
Oil Price Daily Chart
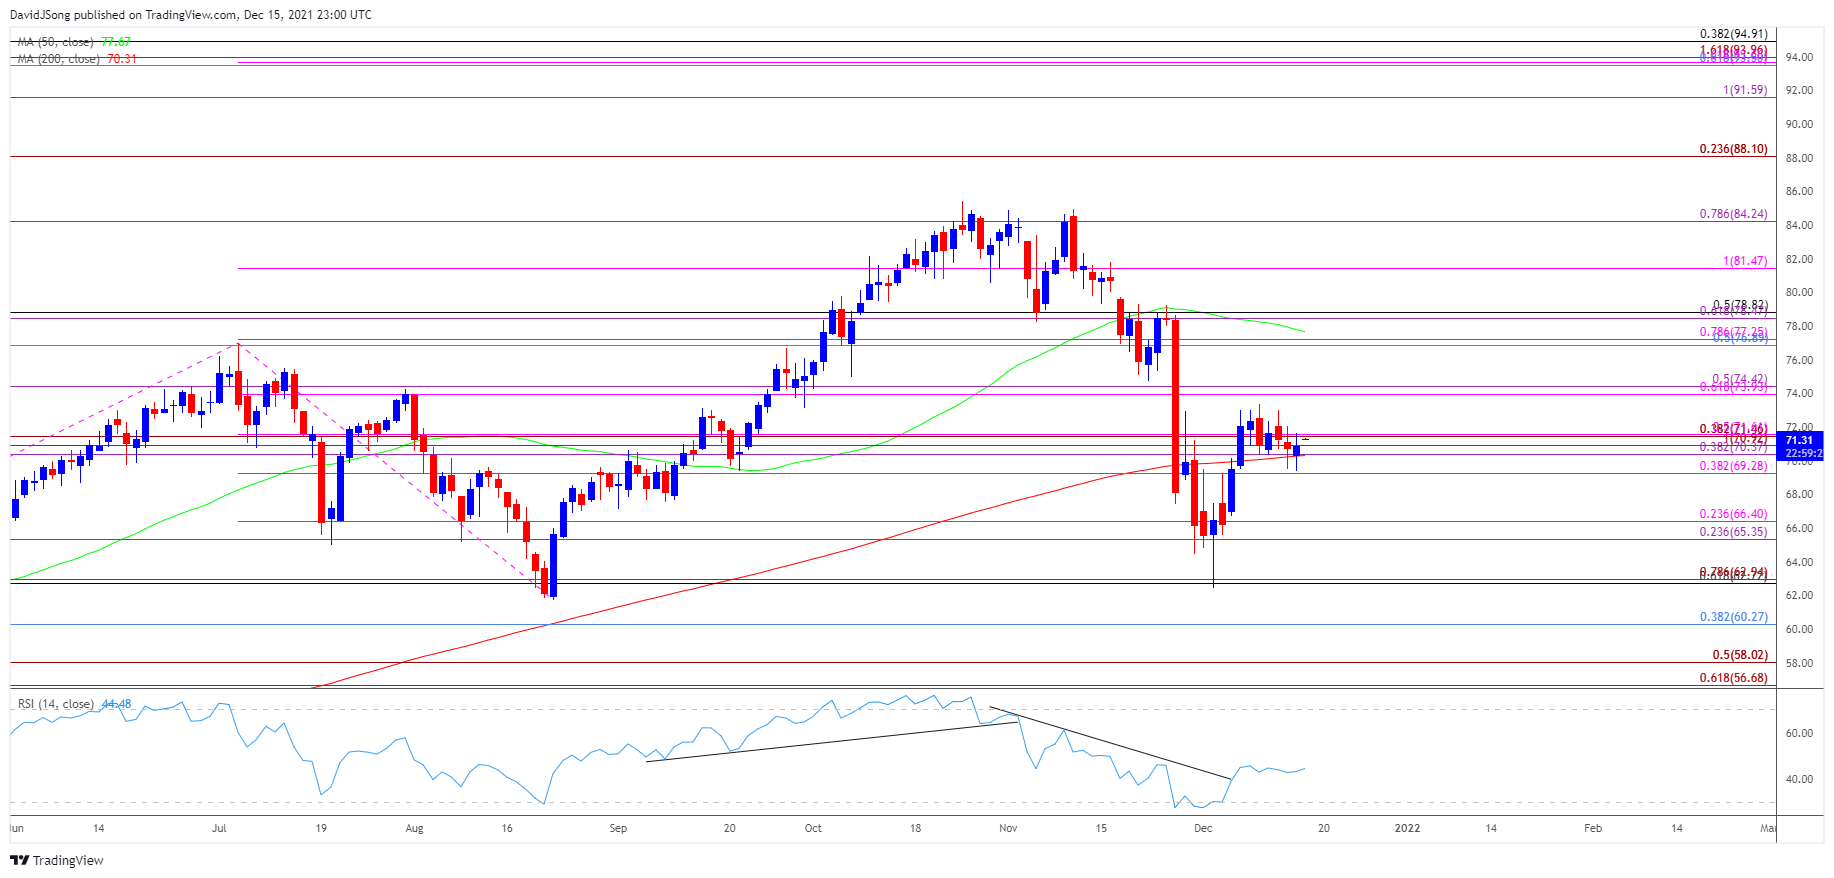
Source: Trading View
- Keep in mind, the price of oil cleared the July high ($76.98) after defending the May low ($61.56), with crude trading to a fresh yearly high ($85.41) in October, which pushed the Relative Strength Index (RSI) above 70 for the first time since July.
- Nevertheless, the price of oil reversed ahead of the October 2014 high ($92.96) as the RSI fell back from overbought territory, but the failed attempt to test the August low ($61.74) has pushed the price of oil back above the 200-Day SMA ($70.27) after slipping below the moving average for the first time in 2021.
- Lack of momentum to push below the $69.30 (38.2% expansion) area may send the price of oil back above the Fibonacci overlap around $70.40 (38.2% expansion) to $71.70 (5% expansion), with a break above the monthly high ($73.34) bringing the $73.90 (61.8% expansion) to $74.40 (50% expansion) area on the radar.
- Next region of interest comes in around $76.90 (50% retracement) to $77.30 (78.6% expansion) followed by the $78.50 (61.8% expansion) to $78.80 (50% expansion) area.

--- Written by David Song, Currency Strategist
Follow me on Twitter at @DavidJSong


