


Japanese Yen Talking Points
USD/JPY extends the decline from the start of the week as the 10-Year US Treasury yield sits near the monthly low (1.44%), and the bull flag formation carried over from last month may continue to unravel with the exchange rate on track to mark a four day decline for the first time since August.
USD/JPY Outlook: Bull Flag Pattern Unravels Following Four Day Decline
USD/JPY continues to trade to fresh monthly lows following the kneejerk reaction to the US Non-Farm Payrolls (NFP) report, and fresh data prints coming out of the world’s largest economy may do little to prop up the exchange rate consolidates despite an uptick in the Producer Price Index (PPI).
According to the US Bureau of Labor Statistics (BLS), factory gate prices increased 0.6% in October after climbing 0.5% the month prior, and it remains to be seen if the update to the Consumer Price Index (CPI) will sway USD/JPY as the headline reading for inflation is seen widening to 5.8% from 5.4% per annum in September, which would mark the highest reading since December 1990.
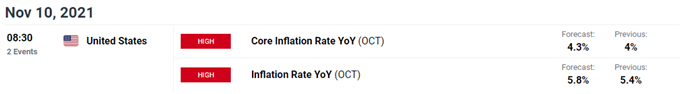
At the same time, the core CPI is expected to increase to 4.3% from 4.0% during the same period, and signs of sticky inflation may lift longer-dated US yields as it puts pressure on the Federal Reserve to implement higher interest rates sooner rather than later.
In turn, the decline from the October high may turn out to be a correction in the broader trend as the Fed starts to scale back monetary support while the Bank of Japan (BoJ) sticks to its Quantitative and Qualitative Easing (QQE) program with Yield-Curve Control (YCC), but a further depreciation in the exchange rate may continue to alleviate the tilt in retail sentiment like the behavior seen earlier this year.
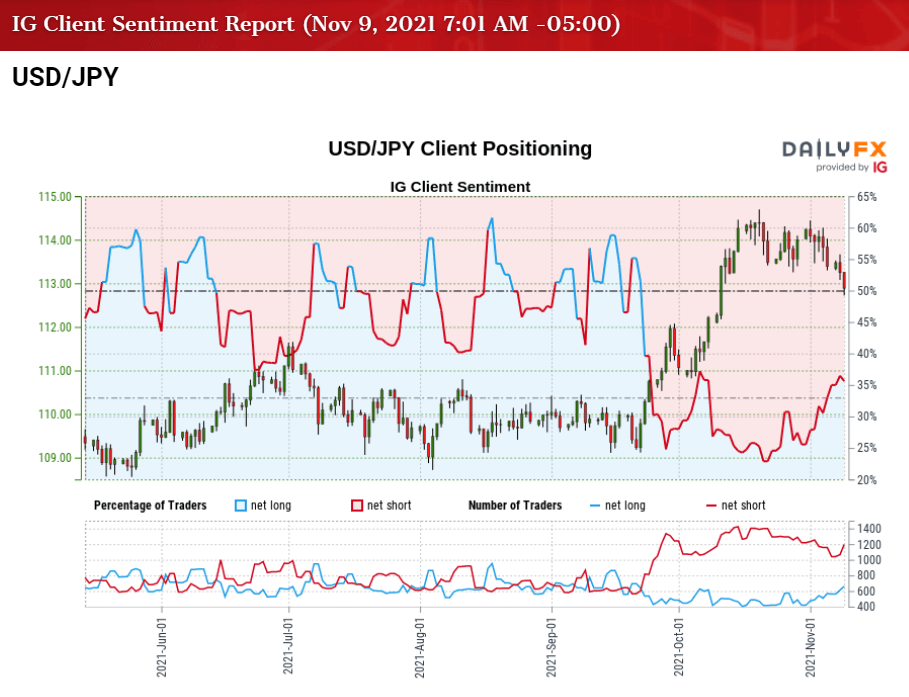
The IG Client Sentiment report shows 34.37% of traders are currently net-long USD/JPY, with the ratio of traders short to long standing at 1.91 to 1.
The number of traders net-long is 3.33% lower than yesterday and 20.79% higher from last week, while the number of traders net-short is 6.27% higher than yesterday and 4.81% higher from last week. The jump in net-long interest has helped to alleviate the crowding behavior as 31.15% of traders were net-long USD/JPY last week, while the rise in net-short position comes as the exchange rate trades to fresh monthly lows.
With that said, USD/JPY may face a larger correction ahead of the next Federal Open Market Committee (FOMC) rate decision on December 15 as the bull flag formation appears to be unraveling, but the Fed’s exit strategy may continue to push the exchange rate to fresh 2021 highs throughout the remainder of the year as speculation for higher interest rates lift US yields.

USD/JPY Rate Daily Chart
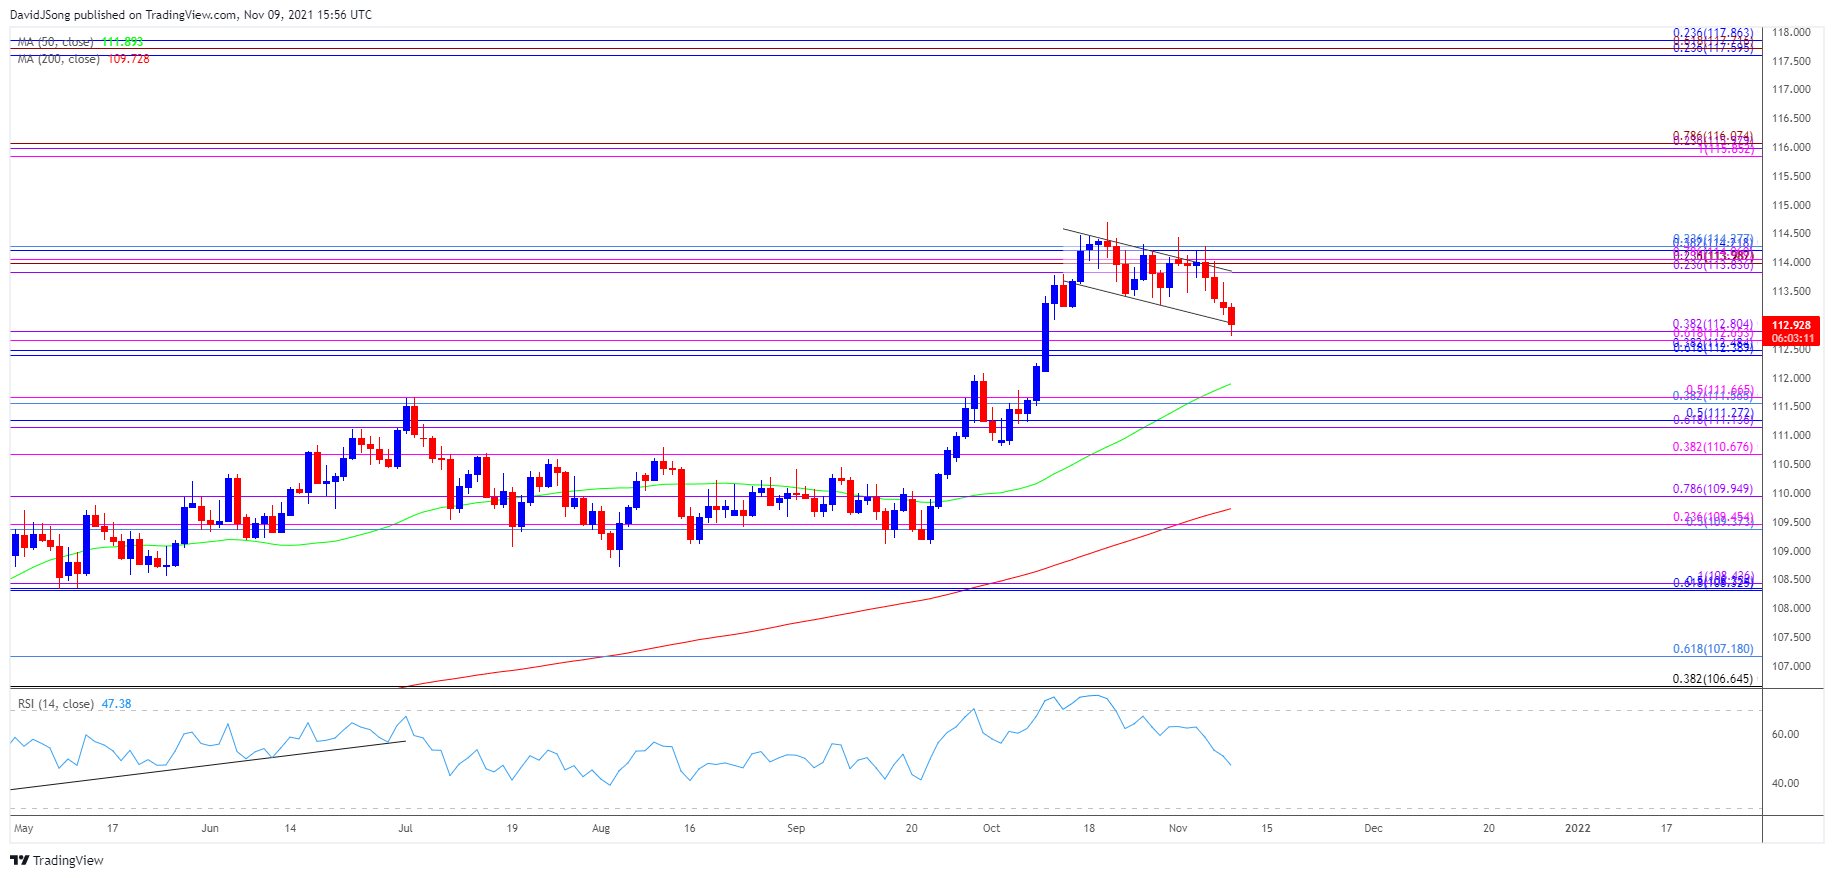
Source: Trading View
- The broader outlook for USD/JPY remains constructive as it trades to fresh yearly highs in the second half of 2021, with the 200-Day SMA (109.73) indicating a similar dynamic as it retains the positive slope from earlier this year.
- The Relative Strength Index (RSI) showed a similar dynamic as it pushed into overbought territory for the first time since the first quarter of 2021, but a textbook sell signal materialized in October as the oscillator fell back from overbought territory to slip below 70.
- In turn, the bull flag formation carried over from last month appears to be unraveling with USD/JPY on track to mark a four day decline for the first time since August, but need a break/close below 112.40 (61.8% retracement) to 112.80 (38.2% expansion) region to bring the Fibonacci overlap around 111.10 (61.8% expansion) to 111.60 (38.2% retracement) on the radar.
- A break of the October low (110.82) opens up the 110.70 (38.2% expansion) region, with the next area of interest coming in around 109.40 (50% retracement) to 110.00 (78.6% expansion).

--- Written by David Song, Currency Strategist
Follow me on Twitter at @DavidJSong


