


Oil Price Talking Points
The price of oil climbs to a fresh monthly high ($73.14) following a larger-than-expected contraction in US inventories, with crude breaking out of a descending channel as fresh data prints point to limited supply.
Oil Price Breaks Out of Descending Channel to Approach August High
The price of oil appears to be on track to test the August high ($73.95) as it clears the opening range for September, and the decline from the July high ($76.98) may turn out to be a correction in the broader trend as the Organization of Petroleum Exporting Countries (OPEC) remain on track to boost “overall production by 0.4 mb/d for the month of October 2021.”
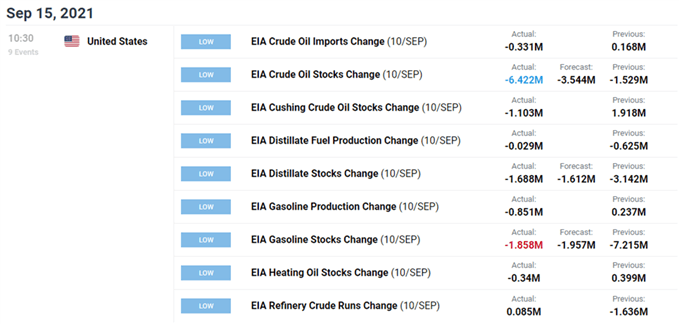
At the same time, fresh data prints coming out of the US may keep the price of oil afloat as inventories contract for six consecutive weeks, with stockpiles narrowing 6.422M in the week ending September 10 versus forecasts for a 3.544M decline.
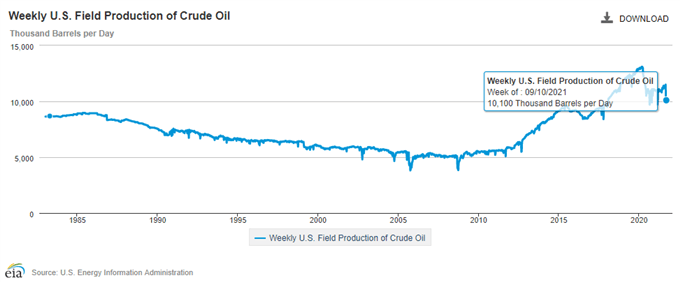
At the same time, disruptions from Hurricane Ida seems to be keeping a lid on US production as the fresh figures from the Energy Information Administration (EIA) shows weekly field output edging up to 10,100K from 10,000K the week prior, and indications of limited supply may continue to act as a backstop for the price of oil as OPEC and its allies remain reluctant to push production towards pre-pandemic levels.
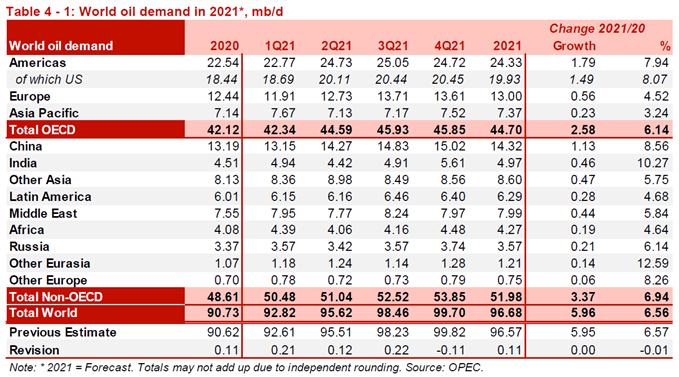
Looking ahead, it remains to be seen if OPEC+ will boost supply at a faster pace as the most recent Monthly Oil Market Report (MOMR) shows a “downward adjustments to 4Q21 estimates,” with the update revealing that “2H21 oil demand has been adjusted slightly lower, partially delaying the oil demand recovery into 1H22.”
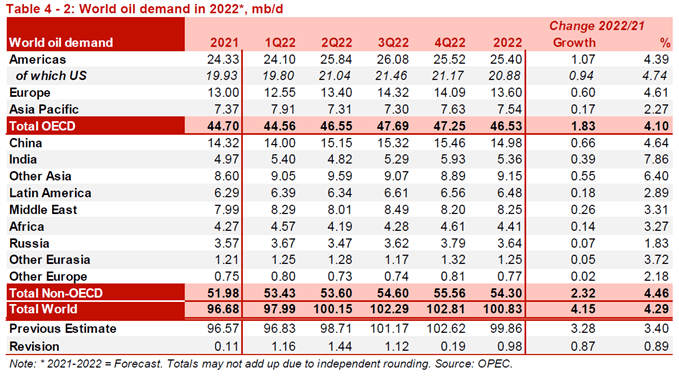
As a result, OPEC and its allies may retain the current level production at the next Ministerial Meeting onOctober 4, but expectations for a further recovery in global demand may put pressure on OPEC+ to boost production as the MOMR emphasizes that “in 2022, oil demand is expected to robustly grow by around 4.2 mb/d, some 0.9 mb/d higher compared to last month’s assessment.”
With that said, developments coming out of the US may continue to sway the price of oil as signs of stronger demand are met with limited supply, and the decline from the July high ($76.98) may turn out to be a correction in the broader trend as crude breaks out of the descending channel from earlier this year.
Oil Price Daily Chart
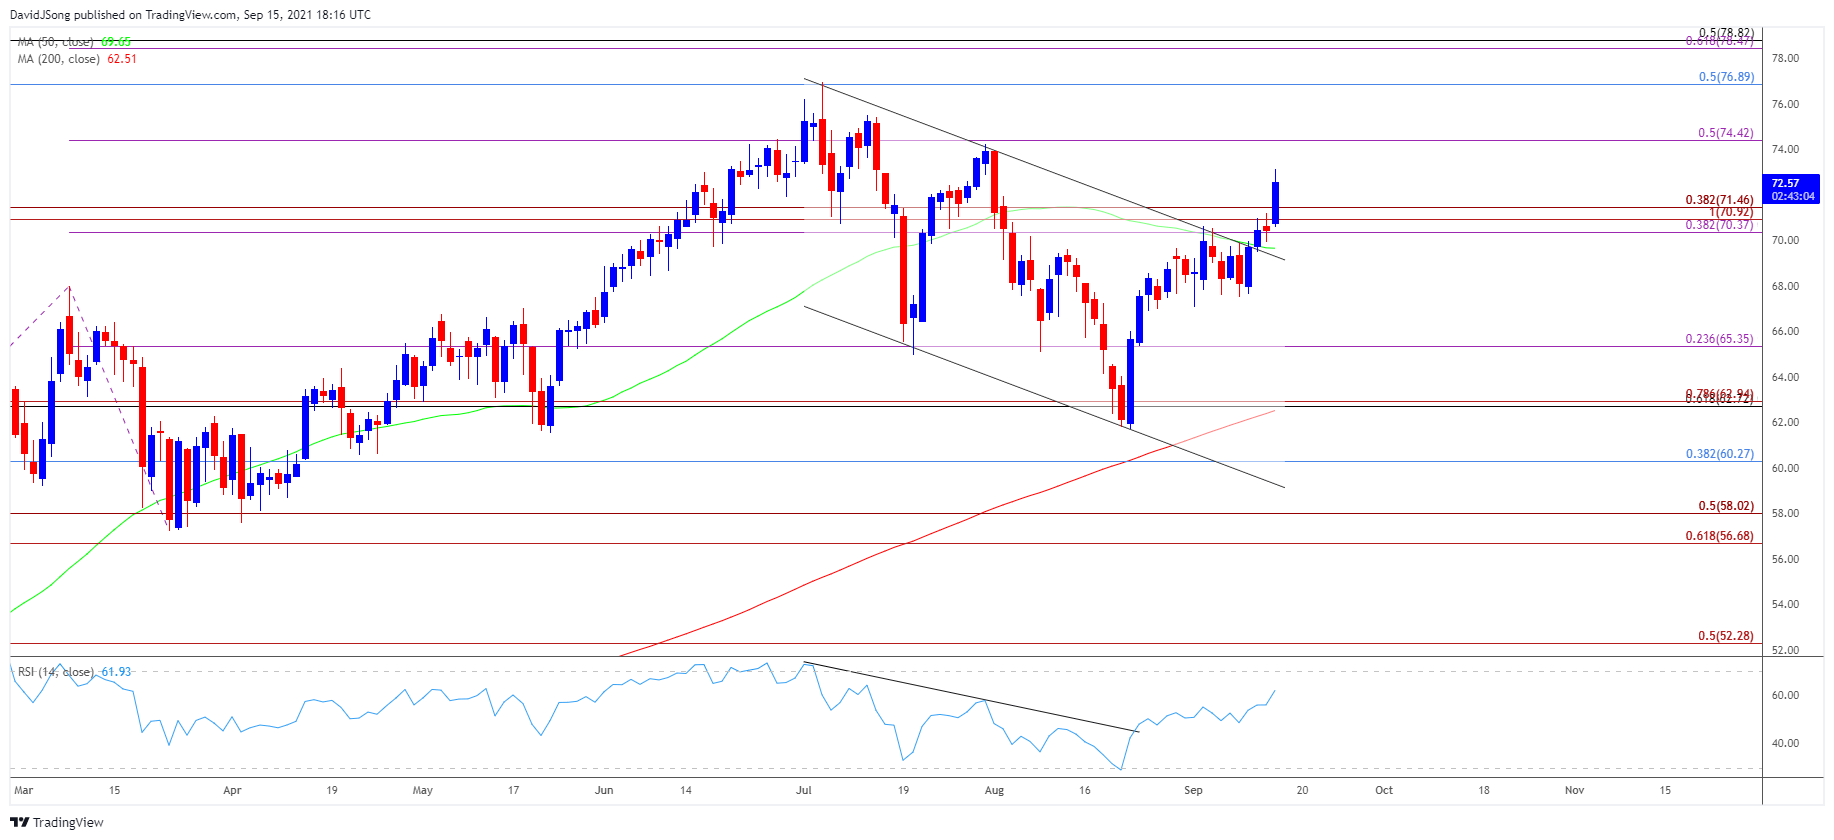
Source: Trading View
- Keep in mind, the price of oil traded to a fresh yearly high ($76.98) in July as both the 50-Day SMA ($69.65) and 200-Day SMA ($62.51) established a positive slope, and the broader outlook for crude remains constructive as the rally from earlier this year removed the threat of a double-top formation.
- However, a descending channel took shape following the failed attempt to test the 2018 high ($76.90), with the price of oil slipping below the 50-Day SMA ($69.65) for the first time since May.
- Nevertheless, the price of oil reversed coursed after defending the May low ($61.56), with crude breaking out of the downward trending channel from earlier this year as it clears the opening range for September.
- The move back above the Fibonacci overlap around $70.40 (38.2% expansion) to $71.50 (38.2% expansion) brings the August high ($73.95) on the radar, with a break/close above the $74.40 (50% expansion) region opening the $76.90 (50% retracement) area, which largely lines up with the July high ($76.98).

--- Written by David Song, Currency Strategist
Follow me on Twitter at @DavidJSong


