


Gold Price Talking Points
The price of gold struggles to extend the series of higher highs and lows carried over from the previous week as it pares the advance following the Kansas City Fed Economic Symposium, and the precious metal may consolidate throughout the week amid the failed attempt to test the monthly high ($1832).
Gold Price Outlook Mired by Failure to Test August High
The price of gold managed to push above the 200-Day SMA ($1809) as Fed Chairman Jerome Powell tamed speculation for an imminent shift in monetary policy, but the rebound from the monthly low ($1682) may turn out to be a correction in the broader trend rather than a change in market behavior as the precious metal struggles to hold above the moving average.
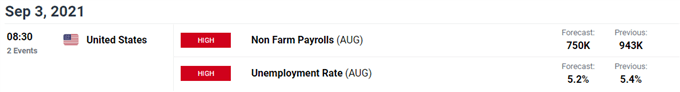
Looking ahead, it seems as though the Federal Open Market Committee (FOMC) will retain an outcome-based approach as Chairman Powell insists that “it could be appropriate to start reducing the pace of asset purchases this year,” and the update to the US Non-Farm Payrolls (NFP) report may sway the monetary policy outlook as the economy is anticipated to add 750K jobs in August.
A further improvement in the US labor market may drag on the price of gold as it puts pressure on the FOMC to switch gears sooner rather than later, but a dismal development may generate a bullish reaction in bullion as it encourages the FOMC to retain the current policy at the next interest rate decision on September 22.
With that said, the price of gold may consolidate ahead of the NFP report as it struggles to extend the series of higher highs and lows carried over from last week, and the rebound from the monthly low ($1682) may turn out to be a correction in the broader trend rather than a change in market behavior as the precious metal struggles to hold above the 200-Day SMA ($1809).
Gold Price Daily Chart
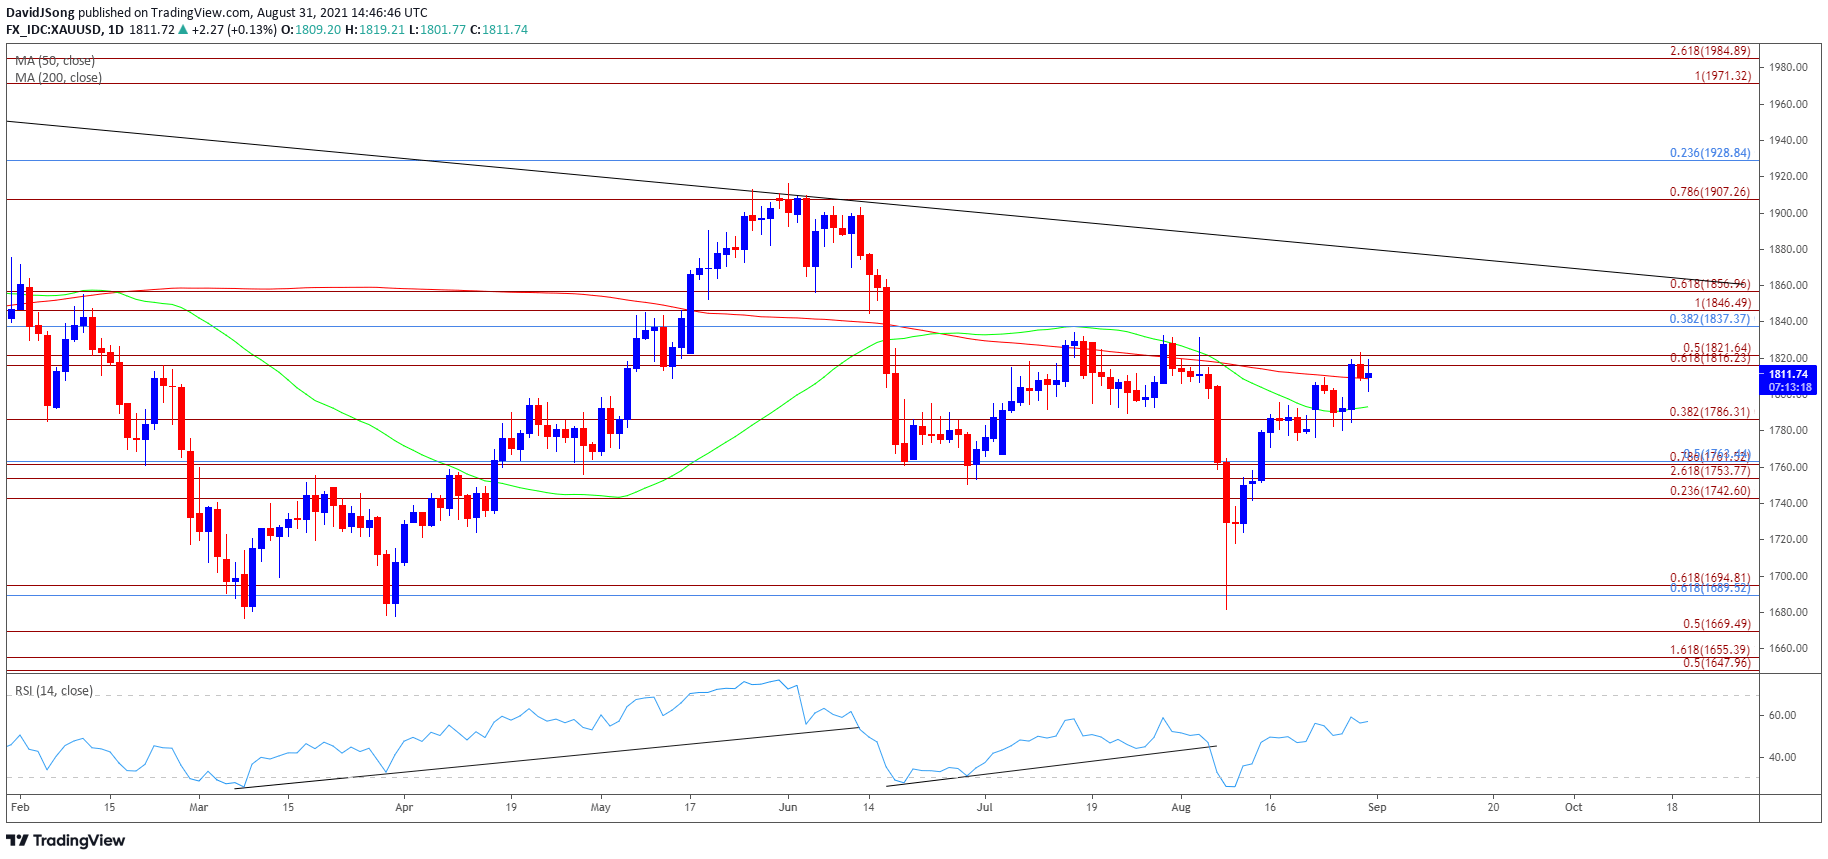
Source: Trading View
- Keep in mind, a double-bottom emerged in March as the price of gold failed to test the June 2020 low ($1671), with the key reversal pattern pushing the precious metal back above the 200-Day SMA ($1809) for the first time since February.
- At the same time, the Relative Strength Index (RSI) pushed into overbought territory for the first time since July 2020 as the price of gold appeared to be on track to test the January high ($1959), but the double-bottom formation seems to have run its course as the RSI no longer tracks the upward trend from earlier this year.
- The negative slopes in both the 50-Day SMA ($1793) and 200-Day ($1809) SMAs indicate that the broader trend for bullion remains tilted to the downside, with a ‘death cross’ formation taking shape in August as the RSI pushed into oversold territory.
- However, lack of momentum to test the March low ($1677) has generated a textbook buy signal in the RSI as the oscillator climbed back above 30, with the move above the $1786 (38.2% expansion) region pushing the price of gold above the 50-Day ($1793).
- Nevertheless, the failed attempt to test the monthly high ($1832) undermines the recent recovery in bullion, with the price of gold struggling to hold above the 200-Day SMA ($1809) following the string of failed attempts to close above the $1816 (61.8% expansion) to $1822 (50% expansion) region.
- In turn, a move below the 50-Day ($1793) may push the price of gold towards the $1786 (38.2% expansion) region, with the next area of interest coming in around $1743 (23.6% expansion) to $1763 (50% retracement).
- and lack of momentum to hold above the 200-Day SMA ($1809) may push the price of gold back below the $1786 (38.2% expansion) region to bring the Fibonacci overlap around $1743 (23.6% expansion) to $1763 (50% retracement) on the radar.

--- Written by David Song, Currency Strategist
Follow me on Twitter at @DavidJSong


