


Gold Price Talking Points
The price of gold has pushed above the 50-Day SMA ($1790) amid the as change to the Kansas City Fed Economic Symposium, but lack of momentum to hold above the moving average may undermine the recent recovery in the precious metal as the indicator develops a negative slope.
Gold Price Recovery Stalls Ahead of Fed Economic Symposium
The recent recovery in the price of gold appears to have stalled ahead of the monthly high ($1832) as it struggles to retain the advance from the start of the week, and the precious metal may consolidate ahead of the Fed symposium amid waning expectations of seeing a material announcement.
The resurgence of COVID-19 cases may encourage Federal Reserve officials to endorse a wait-and-see approach ahead of the next interest rate decision on September 22 as the Federal Open Market Committee (FOMC) “generally judged that the Committee's standard of ‘substantial further progress’ toward the maximumemployment and inflation goals had not yet been met.”
As a result, more of the same from Chairman Jerome Powell and Co. may keep gold prices afloat as the central bank braces for a transitory rise in inflation, but indications of a looming exit strategy may produce headwinds for the precious metal as a growing number of Fed officials show a greater willingness to scale back monetary support.
As a result, a shift in the Fed’s forward guidance may undermine the recovery in bullion, and lack of momentum to hold above the 50-Day SMA ($1790) would case a bearish outlook for the price of gold as a ‘death cross’ takes shape in August.
With that said, the rebound from the monthly low ($1682) may turn out to be a correction in the broader trend rather than a change in market behavior as the 50-Day ($1790) and 200-Day ($1810) SMAs develop a negative slope, and the precious metal may consolidate ahead of the Fed symposium amid the failed attempt to test the monthly high ($1832).
Gold Price Daily Chart
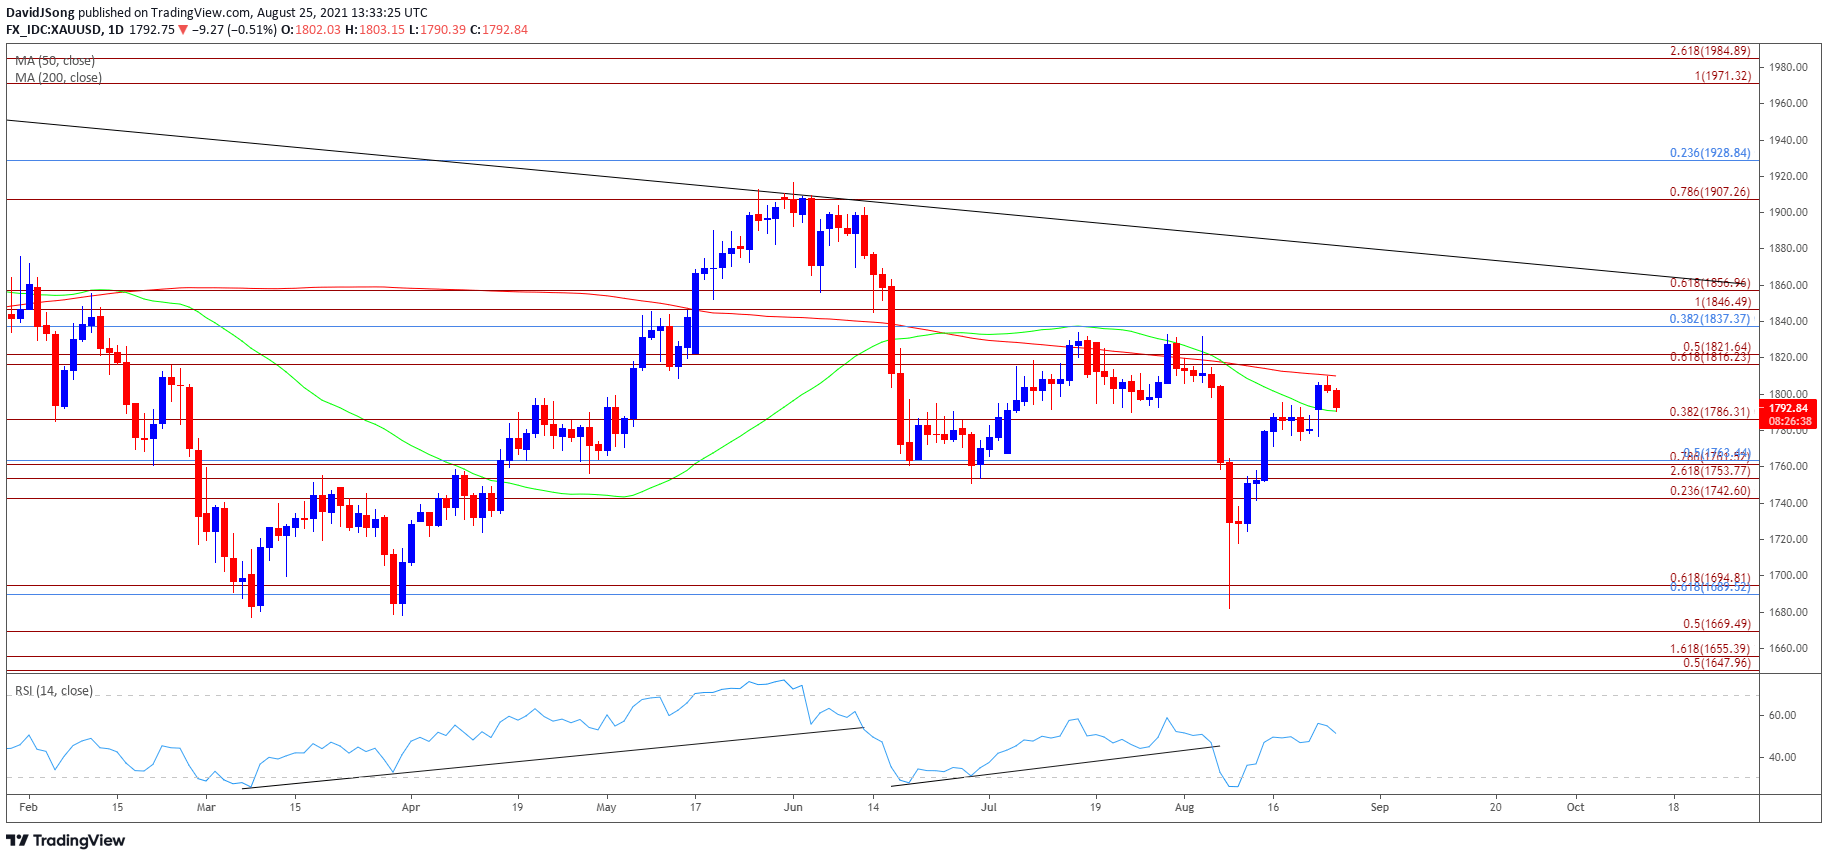
Source: Trading View
- Keep in mind, a double-bottom emerged in March as the price of gold failed to test the June 2020 low ($1671), with the key reversal pattern pushing the precious metal back above the 200-Day SMA ($1810) for the first time since February.
- At the same time, the Relative Strength Index (RSI) pushed into overbought territory for the first time since July 2020 as the price of gold appeared to be on track to test the January high ($1959), but the double-bottom formation seems to have run its course as the RSI no longer tracks the upward trend from earlier this year.
- The negative slopes in both the 50-Day SMA ($1790) and 200-Day ($1810) SMAs indicate that the broader trend for bullion remains tilted to the downside, with a ‘death cross’ formation taking shape in August as the RSI pushed into oversold territory.
- However, lack of momentum to test the March low ($1677) has generated a textbook buy signal in the RSI as the oscillator climbed back above 30, with the move above the $1786 (38.2% expansion) region pushing the price of gold above the 50-Day ($1790).
- Nevertheless, the failed attempt to test the monthly high ($1832) undermines the recent recovery in bullion, and lack of momentum to hold above the 50-Day ($1790) may push the price of gold back below the $1786 (38.2% expansion) region to bring the Fibonacci overlap around $1743 (23.6% expansion) to $1763 (50% retracement) on the radar.
- Next area of interest comes in around $1690 (61.8% retracement) to $1695 (61.8% expansion), with a break of the monthly low ($1682) opening up the $1670 (50% expansion) region.

--- Written by David Song, Currency Strategist
Follow me on Twitter at @DavidJSong


