


Oil Price Talking Points
The price of oil slips to a fresh weekly low ($65.04) despite a larger-than-expected decline in US inventories, with crude on the cusp of taking out the July low ($65.01) as US production increases for the second straight week.
Oil Price Slides Towards July Low as US Output Rises for Second Week
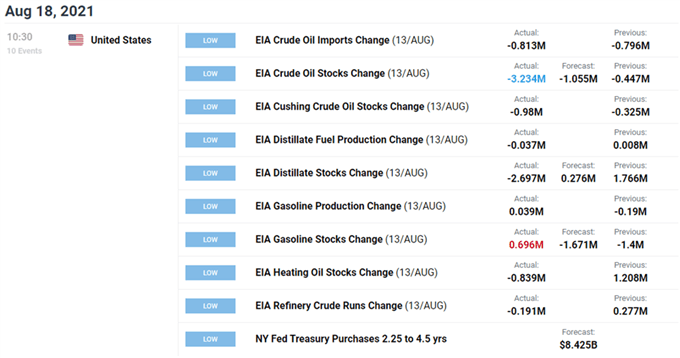
The price of oil showed a kneejerk reaction to the fresh data prints coming out of the US as crude inventories fell 3.234M in the week ending August 13 versus forecasts for a 1.055M decline, but indications of stronger demand may keep the Organization of Petroleum Exporting Countries (OPEC) on track to boost production by “0.4 mb/d on a monthly basis” as the group raises its outlook for global growth.
OPEC’s most recent Monetary Oil Market Report (MOMR) acknowledged that the uptrend in the price of oil“was capped by lingering concerns regarding the rise of COVID-19 infections,” but still showed expectations for a robust recovery as “global economic growth forecasts for both 2021 and 2022 were revised up by 0.1 pp.”
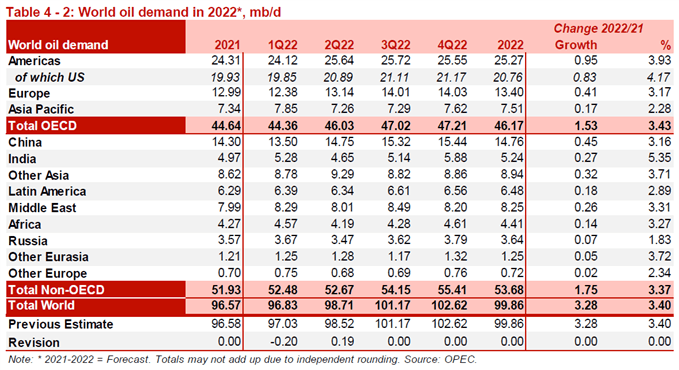
In turn, the update for August revealed that “world oil demand growth expectations for 2021 remained unchanged from the previous month’s assessment,” with the report going onto say that “total world oil demand is projected to surpass the 100 mb/d threshold in 2H22 and reach 99.9 mb/d on average for the whole of 2022.”
Ongoing expectations for strong consumption may keep the price of oil afloat as OPEC and its allies remain in no rush to restore production to pre-pandemic levels, but a further pickup in US output may continue to drag on crude prices as it climbs to its highest level since May 2020.
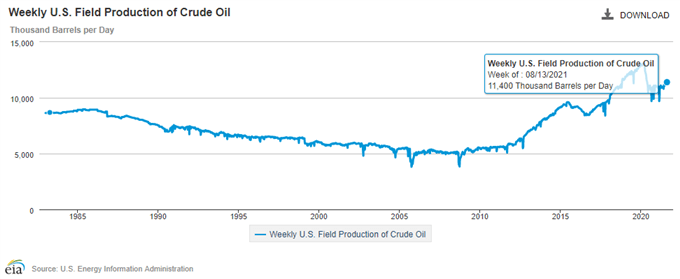
A deeper look at the figures coming out of the Energy Information Administration (EIA) showed weekly US field production climbing to 11,400K from 11,300K in the week ending August 6, and it remains to be seen if OPEC and its allies will respond to the developments coming out of the world’s largest economy as the Biden Administration insists that “OPEC+ must do more to support the recovery.”
With that said, the price of oil may face headwinds ahead of the next OPEC and non-OPEC Ministerial Meeting on September 1 amid the ongoing improvement in US output, but failure to take out the July low ($65.01) may keep crude prices within a defined range
Oil Price Daily Chart
Source: Trading View
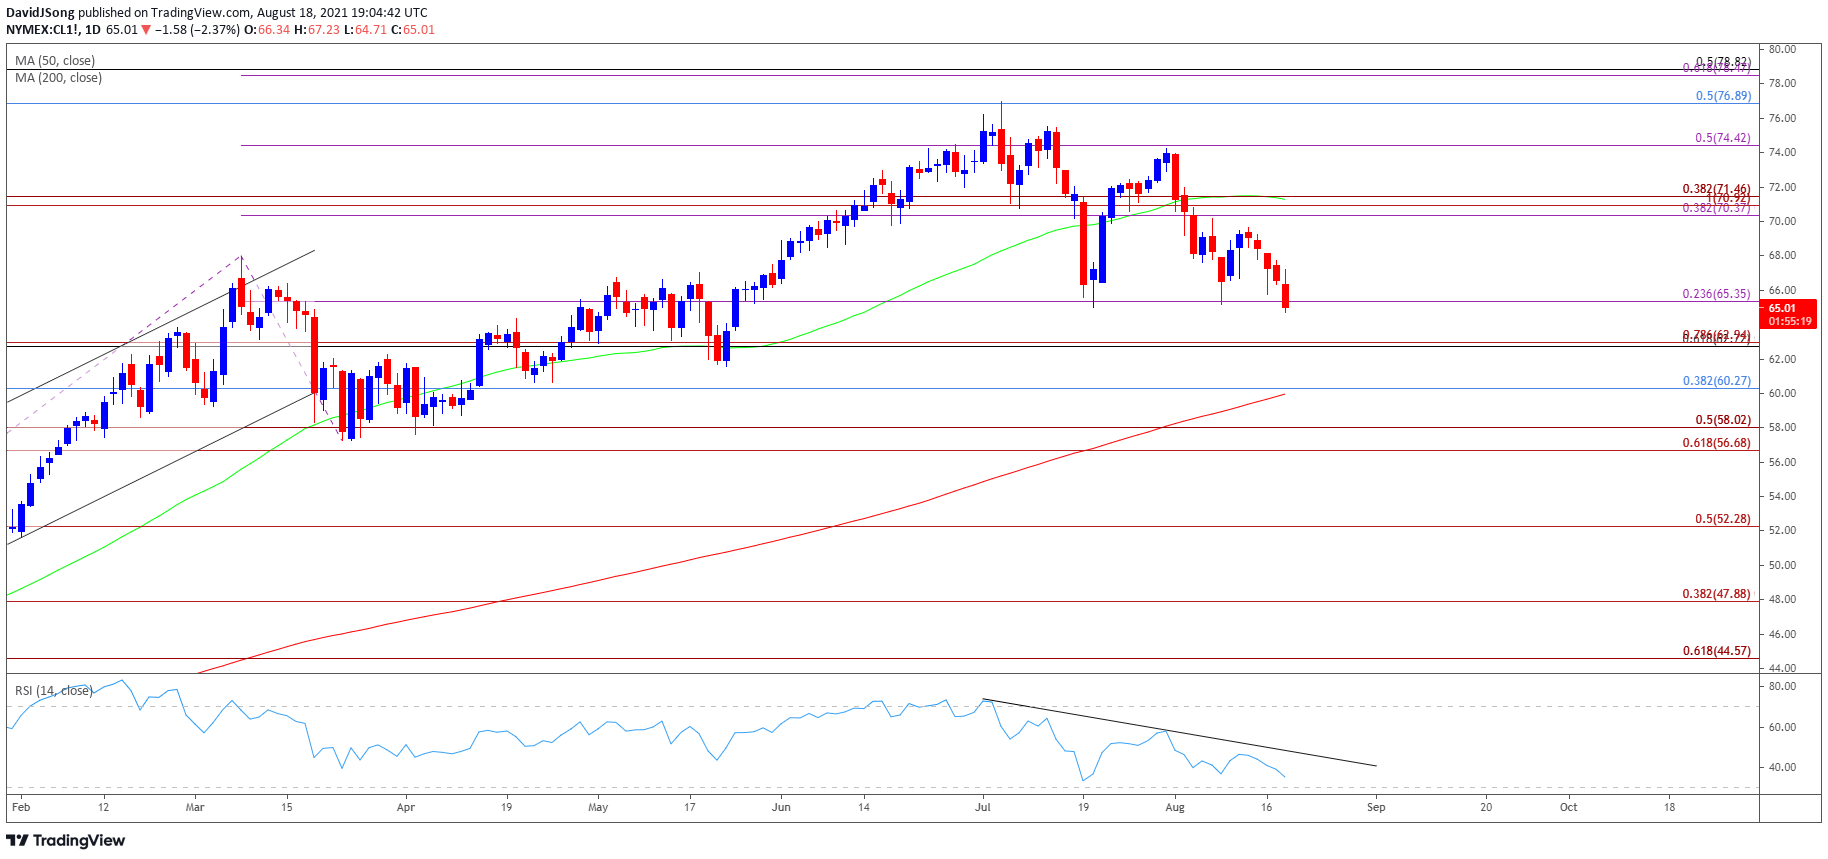
- Keep in mind, crude broke out of the range bound price action from the third quarter of 2020 as it established an upward trending channel, with the price of oil taking out the 2019 high ($66.60) as both the 50-Day SMA ($71.26) and 200-Day SMA ($59.93)established a positive slope.
- The broader outlook for crude remains constructive as the rally from earlier this year removed the threat of a double-top formation, but lack of momentum to test the 2018 high ($76.90) pushed crude below the 50-Day SMA ($71.25), with the Relative Strength Index (RSI) establishing a downward trend after flashing a textbook sell signal in July.
- In turn, the price of oil is on the cusp of taking out the July low ($65.01), with a close below the $65.40 (23.6% expansion) region bringing the $62.70 (61.8% retracement) to $62.90 (78.6% expansion) area on the radar.
- Next area of interest comes in around $60.30 (38.2% retracement), with a move below the 200-Day SMA ($59.93) opening up the Fibonacci overlap around $56.70 (61.8% expansion) to $58.00 (50% expansion).
- However, failure to take out the July low ($65.01) may keep the price of oil within a defined range, with a move above the overlap around $70.40 (38.2% expansion) to $71.50 (38.2% expansion) bringing the $74.40 (50% expansion) region back on the radar.

--- Written by David Song, Currency Strategist
Follow me on Twitter at @DavidJSong


