


Oil Price Talking Points
The price of oil trades to fresh weekly high ($69.36) despite a smaller-than-expected decline in US inventories, and crude may stage a larger advance over the coming days as it extends the series of higher highs and lows from the start of the week.
Oil Price Forecast: Crude Rebound Emerges amid Failed Test of July Low
The price of oil fills the gap from the start of the week following the failed attempt to test the July low ($65.01), but a press release from White House National Security Advisor Jake Sullivan appears to be hampering the outlook for crude prices as the Biden Administration argues that the recent agreement by the Organization of Petroleum Exporting Countries (OPEC) “will not fully offset previous production cuts that OPEC+ imposed during the pandemic.”
In turn, the US goes onto say that “OPEC+ must do more to support the recovery,” and it seems as though the stickiness in the price of oil will become a growing concern for the Biden Administration as US inventories contract 0.447M in the week ending August 6 versus projections for a 1.27M decline.
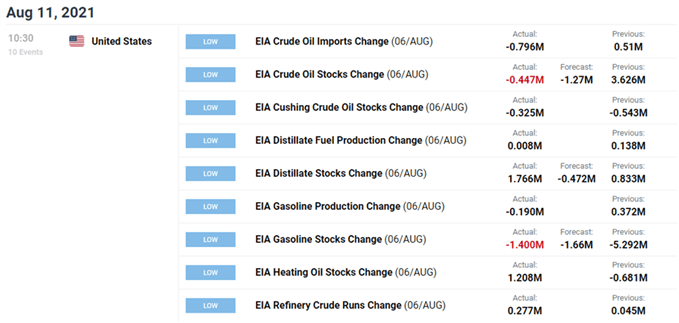
Nevertheless, signs of slowing demand may keep OPEC+ on its current course to restore production as the most recent Monthly Oil Market Report (MOMR) emphasizes that “the positive developments in the containment of the pandemic as well as the solid expectations for global economic growth are assumed to spur consumption for oil in 2022,” and the tepid recovery in US output may keep the price of oil afloat as the fresh figures from the Energy Information Administration (EIA) shows weekly field production widening to 11,300 during the same period after holding steady at 11,200K for two consecutive week.
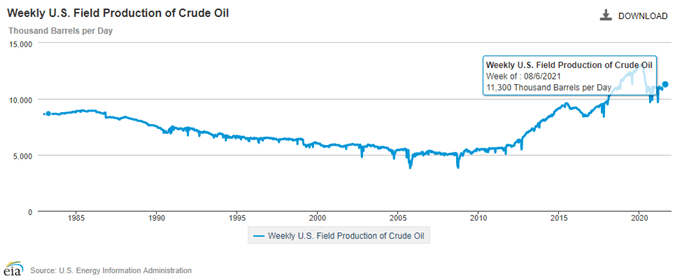
With that said, current market conditions may keep crude prices afloat ahead of the next OPEC and non-OPEC Ministerial Meeting on September 1 as US output remains well below pre-pandemic levels, and the price of oil may continue to carve a series of higher highs and lows over the coming days as it appears to have reversed course ahead of the July low ($65.01).
Oil Price Daily Chart
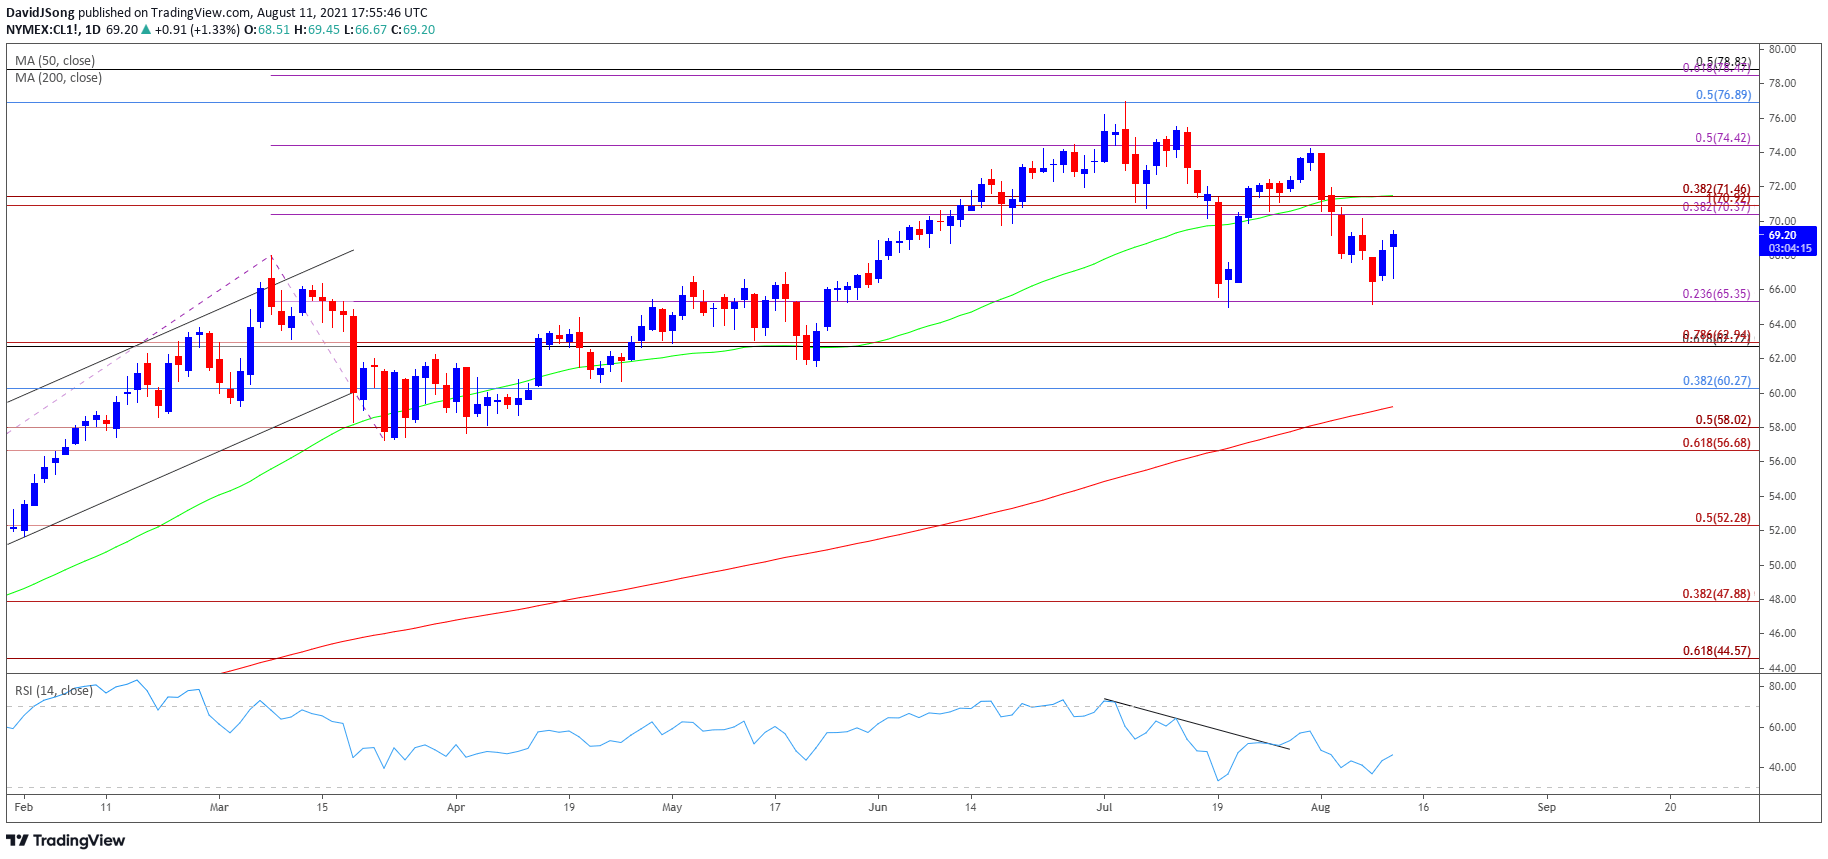
Source: Trading View
- Keep in mind, crude broke out of the range bound price action from the third quarter of 2020 as it established an upward trending channel, with the price of oil taking out the 2019 high ($66.60) as both the 50-Day SMA ($71.46) and 200-Day SMA ($59.19)established a positive slope.
- The broader outlook for crude remains constructive as the rally from earlier this year removed the threat of a double-top formation, but lack of momentum to test the 2018 high ($76.90) pushed crude below the 50-Day SMA ($71.46), with the Relative Strength Index (RSI) establishing a downward trend after flashing a textbook sell signal in July.
- However, the price of oil appears to have reversed course ahead of the July low ($65.01) as it extends the series of higher highs and lows from the start of the week, with the failed attempt to break/close below the $65.30 (23.6% expansion) region raising the scope for a move towards the Fibonacci overlap around $70.40 (38.2% expansion) to $71.50 (38.2% expansion), which lines up with the 50-Day SMA ($71.46).
- Need a break/close above the Fibonacci overlap around $70.40 (38.2% expansion) to $71.50 (38.2% expansion) to bring the $74.40 (50% expansion) region on the radar, with the next area of interest coming in around $76.90 (50% retracement), which largely lines up with the 2021 high ($76.98).

--- Written by David Song, Currency Strategist
Follow me on Twitter at @DavidJSong


