


Gold Price Talking Points
The price of gold struggles to retain the rebound from the monthly low ($1761) as Federal Reserve officials show a greater willingness to winddown the quantitative easing (QE) program, and the previous metal may continue to face headwinds over the coming days as the US Non-Farm Payrolls (NFP) report is anticipated to show job growth increasing for the sixth consecutive month.
Gold Price Susceptible to NFP Report amid Looming Fed Exit Strategy
The price of gold appears to be stuck in a narrow range as Chairman Jerome Powell tells US lawmakers that “the Fed will do everything we can to support the economy for as long as it takes to complete the recovery,” but the update to the NFP report may drag on bullion as the US economy is now expected to add 690K jobs in June.
A further improvement in the labor market may spur a growing dissent within the Federal Reserve as Boston Fed President Eric Rosengren, who votes on the Federal Open Market Committee (FOMC) in 2022, insists that “it’s certainly time to start thinking about how quickly is it appropriate to remove accommodation” while speaking at Official Monetary and Financial Institutions Forum (OMFIF) Fed Week Financial Stability Session.
Rosengren went onto say that “it’s quite likely that the ‘substantial further progress’ criteria, at least in my own personal view, will likely be met prior to the beginning of next year,” and signs of a robust recovery may spur a dissent within the FOMC as the central bank braces for a transitory rise in inflation.
In turn, fresh developments coming out of the US may continue to sway gold prices as a growing number of Fed officials adopt a hawkish tone, and it remains to be seen if the FOMC will adjust the forward guidance at the next interest rate decision on July 28 as Chairman Powell and Co. forecast two rate hikes for 2023.
Until then, the double-bottom formation from earlier this year may continue to unravel as the price of gold trades below the 50-Day SMA ($1834) for the first time since April, and another move below 30 in the RSI is likely to be accompanied by a further decline in bullion like the behavior seen earlier this year.
Gold Price Daily Chart
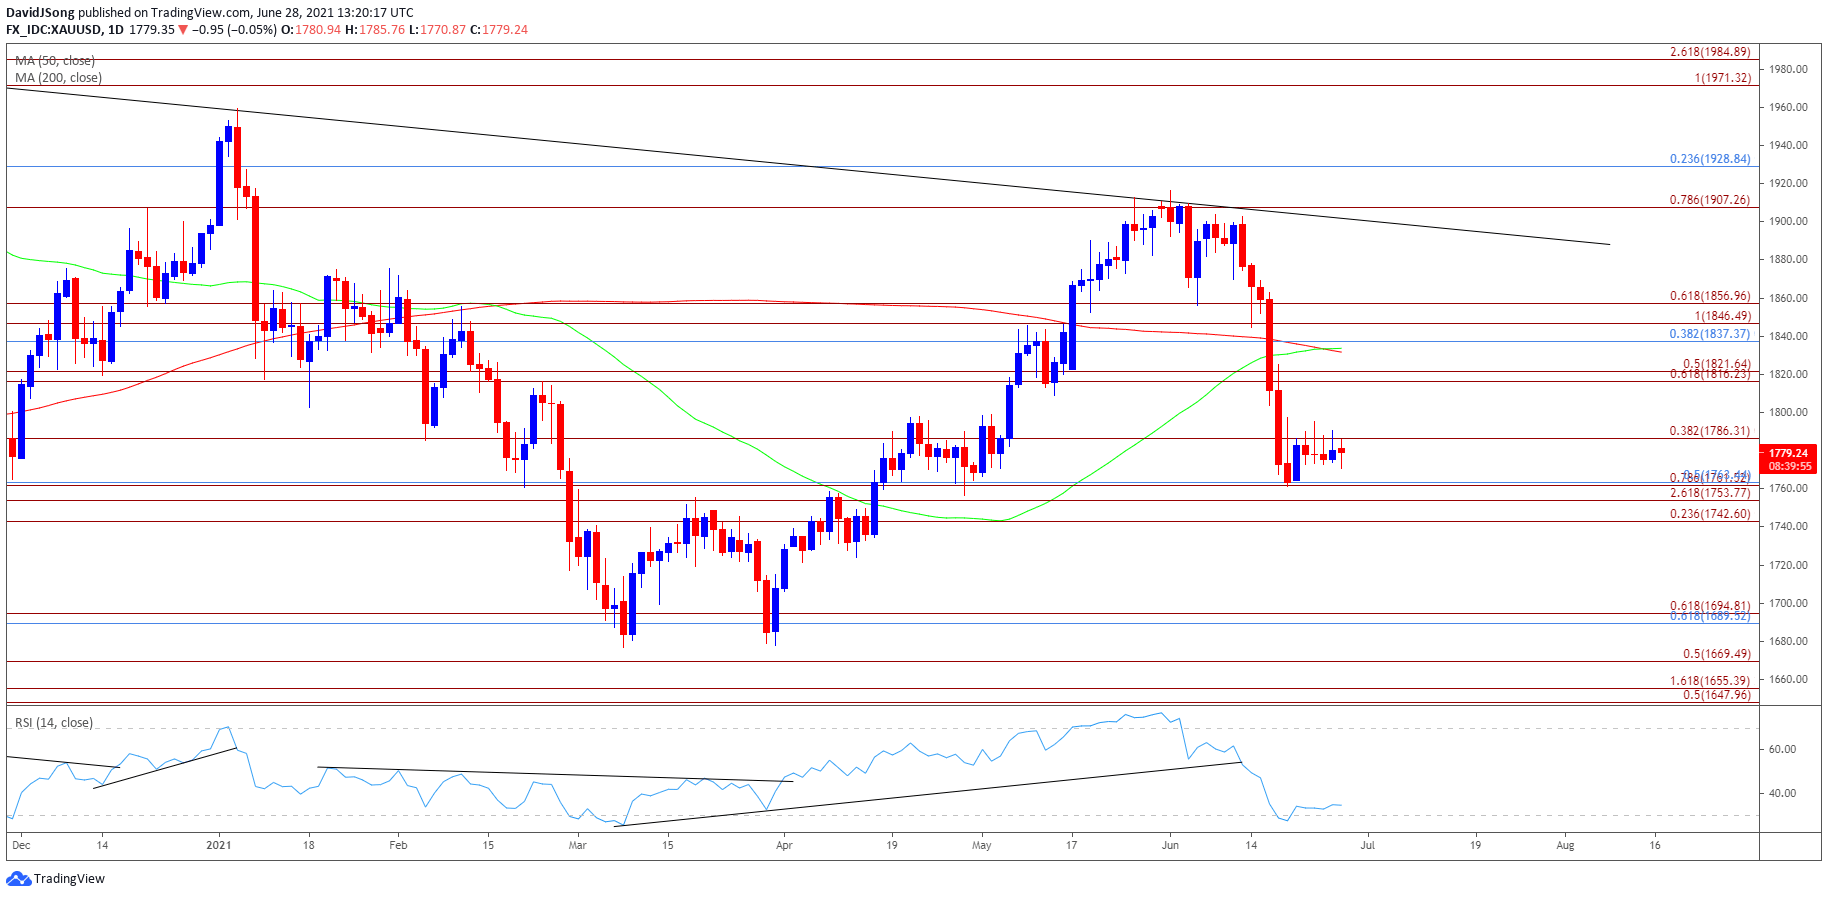
Source: Trading View
- Keep in mind, a double-bottom emerged in March as the price of gold failed to test the June 2020 low ($1671), with the key reversal pattern pushing the precious metal back above the 200-Day SMA ($1832) for the first time since February.
- At the same time, the Relative Strength Index (RSI) pushed into overbought territory for the first time since July 2020 as the price of gold appeared to be on track to test the January high ($1959), but the double-bottom formation seems to have run its course as the RSI snaps the upward trend from earlier this year.
- As a result, bullion now trades below the 50-Day SMA ($1834) for the first time since April, with the recent rebound in the price of gold accompanied by a textbook buy signal in the RSI as the oscillator crossed above 30.
- Nevertheless, the RSI may continue to flirt with oversold territory as the rebound from the monthly low ($1761) appears to capped by the $1786 (38.2% expansion) region, with another move below 30 in the indicator likely to be accompanied by a decline in gold prices like the behavior seen in March.
- Need a break/close below the Fibonacci overlap around $1743 (23.6% expansion) to $1763 (50% retracement) to open up the April low ($1706), with the next area of interest coming in around $1690 (61.8% retracement) to $1695 (61.8% expansion) region.

--- Written by David Song, Currency Strategist
Follow me on Twitter at @DavidJSong


