


Canadian Dollar Talking Points
USD/CAD has cleared the September 2017 low (1.2061) as it dipped to a fresh yearly low (1.2046) in May, but the Relative Strength Index (RSI) indicates a textbook buy signal as it climbs out of oversold territory and pushes above 30.
USD/CAD Faces RSI Buy Signal After Clearing September 2017 Low
The recent decline in USD/CAD appears to be unraveling following the larger-than-expected spike in the US Consumer Price Index (CPI), and it remains to be seen if the Retail Sales report will influence the exchange rate as household consumption is expected to slow in April.
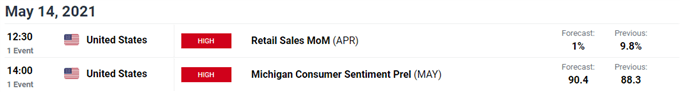
Retail spending is projected to increase 1.0% after expanding 9.8% in March, and signs of a less robust recovery may generate a bearish reaction in the US Dollar as it encourages the Federal Reserve to further support the economy.
In fact, recent remarks from Vice-Chair Richard Clarida suggests the Federal Open Market Committee (FOMC) is in no rush to switch gears as inflation is “likely to rise somewhat further before moderating later this year,” and the central bank may stick to the same script at its next interest rate decision on June 16 as Fed officials brace for a transitory rise in inflation.
The deviating paths for monetary policy casts a bearish outlook for USD/CAD as the Bank of Canada (BoC) tapers its quantitative easing (QE) program, and but the crowding behavior carried over from last year looks poised to persist as retail traders have been net-long USD/CAD since May 2020.
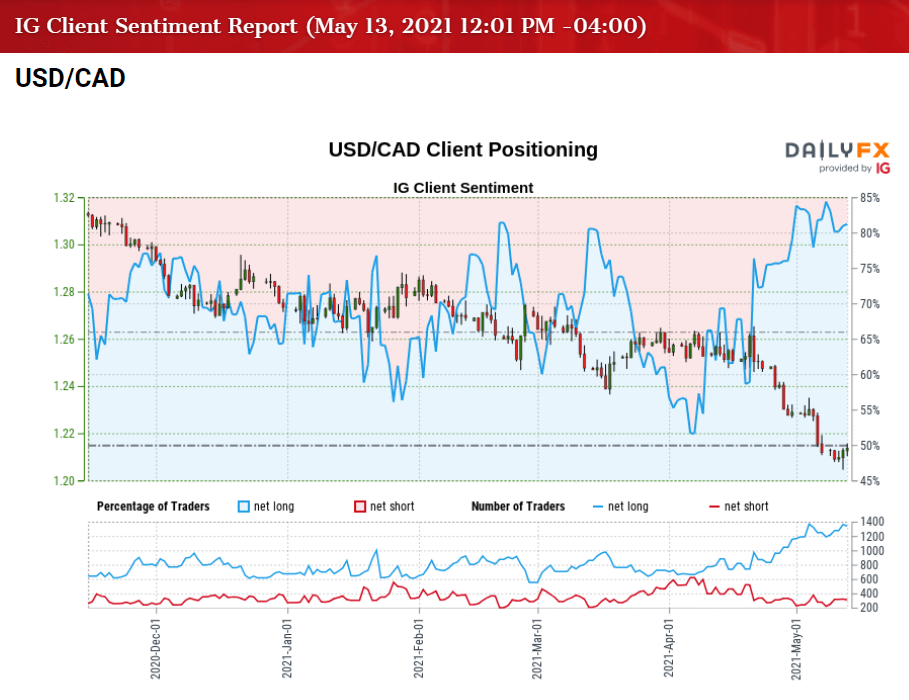
The IG Client Sentiment report shows 81.62% of traders are still net-long USD/CAD, with the ratio of traders long to short standing at 4.44 to 1.
The number of traders net-long is 8.55% higher than yesterday and 18.02% higher from last week, while the number of traders net-short is 8.75% higher than yesterday and 2.54% higher from last week. The rise in net-long position comes as the RSI indicates a textbook buy signal for USD/CAD, while the small rise in net-short interest has done little to alleviate the crowding behavior as 76.93% of traders were net-long the pair earlier this week.
With that said, USD/CAD may continue to exhibit a bearish trend in 2021 as the tilt in retail sentiment persists, but the exchange rate may face a larger rebound over the coming days as the Relative Strength Index (RSI) indicates a textbook buy signal.

USD/CAD Rate Daily Chart
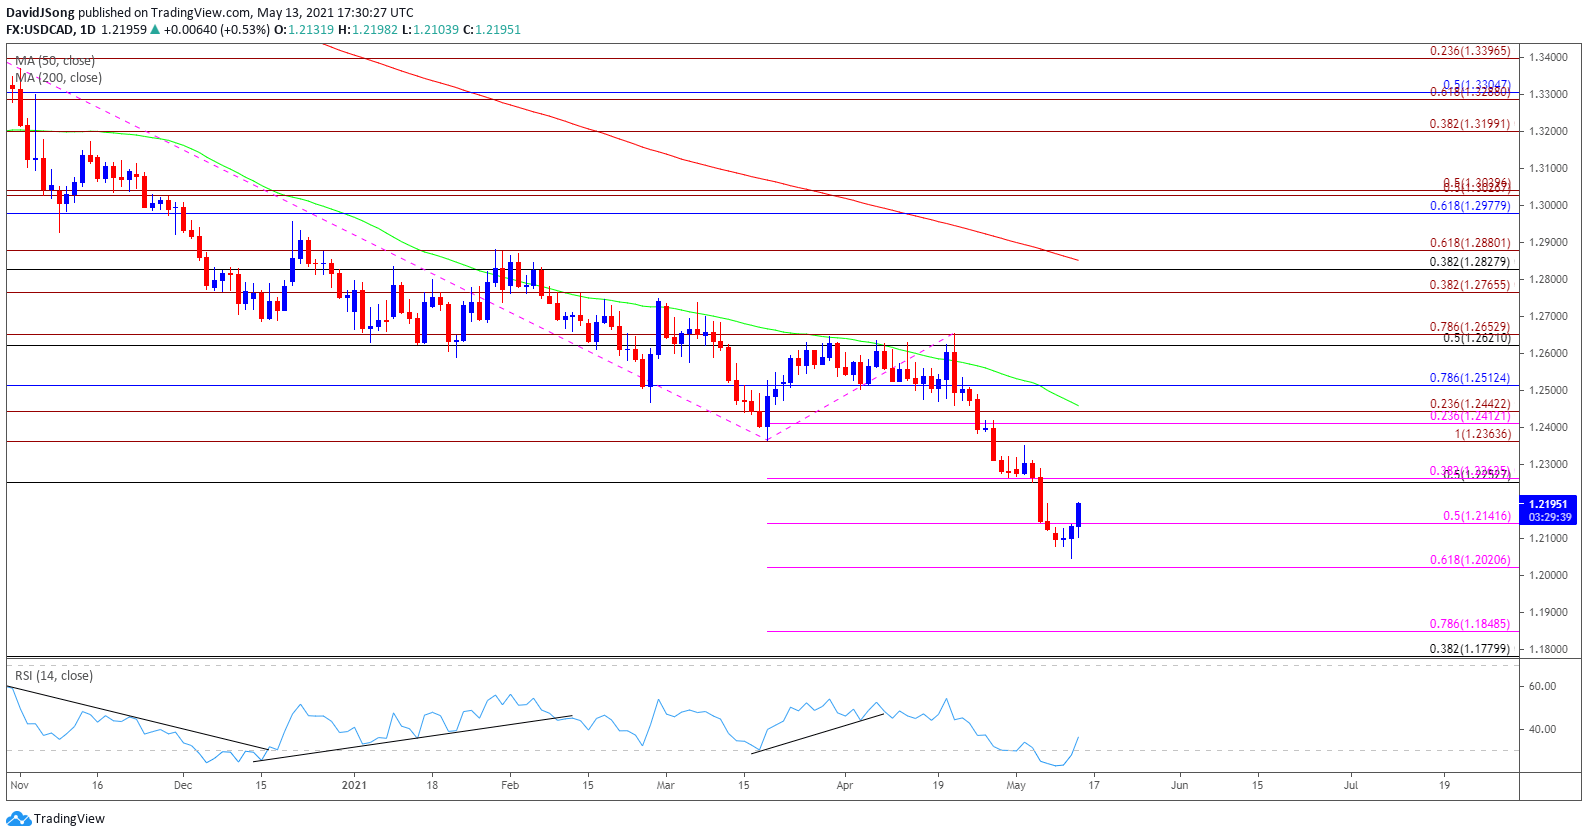
Source: Trading View
- The broader outlook for USD/CAD remains tilted to the downside as it trades to a fresh yearly low (1.2046) in May, with both the 50-Day (1.2458) and 200-Day (1.2852) SMA’s still tracking the negative slope carried over from the previous year.
- The Relative Strength Index (RSI) highlighted a similar dynamic as the indicator pushed below 30 for the first time in 2021, but the oscillator now indicates a textbook buy signal as it climbs out of oversold territory and pushes above 30.
- USD/CAD may stage a larger rebound following the failed attempt to test the 1.2020 (61.8% expansion) region, with a close above the 1.2140 (50% expansion) region opening up the former-support zone around 1.2250 (50% expansion) to 1.2260 (38.2% expansion).
- Next area of interest coming in around 1.2360 (100% expansion) followed by the Fibonacci overlap around 1.2410 (23.6% expansion) to 1.2440 (23.6% expansion).

--- Written by David Song, Currency Strategist
Follow me on Twitter at @DavidJSong


